justifications for energy saving technology
play

Justifications for Energy-Saving Technology A matter of energy and - PDF document

Justifications for Energy-Saving Technology A matter of energy and environmental policy Dr. Ross McCluney Principal Research Scientist Florida Solar Energy Center A research institute of the University of Central Florida Energy Saving


  1. Justifications for Energy-Saving Technology A matter of energy and environmental policy Dr. Ross McCluney Principal Research Scientist Florida Solar Energy Center A research institute of the University of Central Florida 
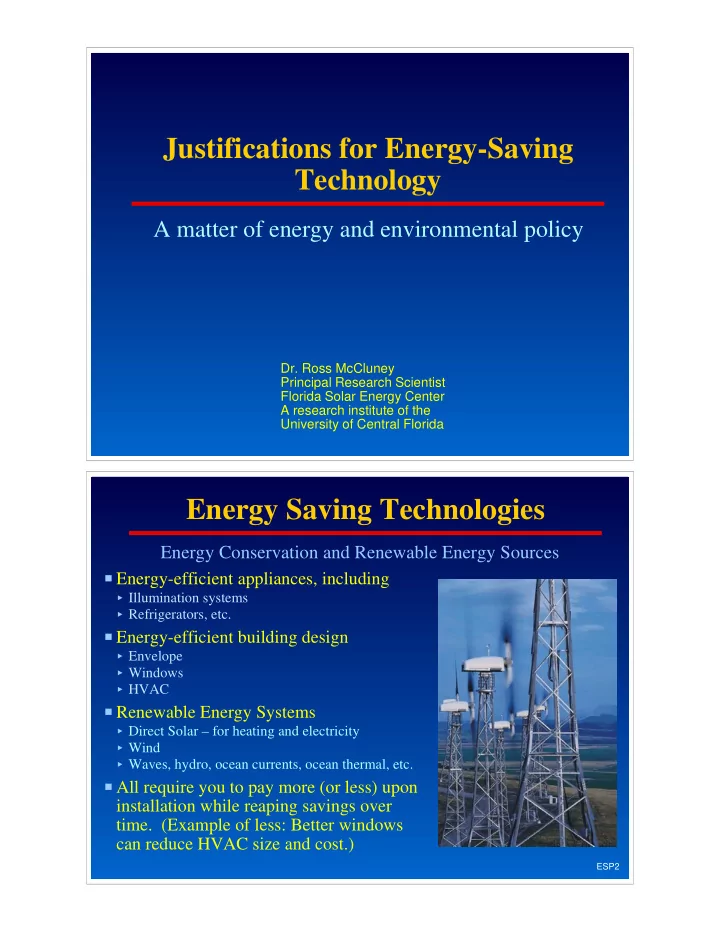
Energy Saving Technologies Energy Conservation and Renewable Energy Sources P Energy-efficient appliances, including < Illumination systems < Refrigerators, etc. P Energy-efficient building design < Envelope < Windows < HVAC P Renewable Energy Systems < Direct Solar – for heating and electricity < Wind < Waves, hydro, ocean currents, ocean thermal, etc. P All require you to pay more (or less) upon installation while reaping savings over time. (Example of less: Better windows can reduce HVAC size and cost.) ESP2

  2. Traditional Energy Accounting Begins with Costs and Savings P First are the dollar costs of “extra” features in the building, compared with the base case. < Extra cost of double pane, coatings, and insulating gas fill < Extra cost of insulated roofs, walls, and window frames < Extra cost of external shading devices or vegetation < Extra cost of more efficient appliances and HVAC systems P Let C be the total of all the extra costs you incur, in dollars P Then you have to know the dollar value of the energy savings in a typical year generated by these extra costs. P This comes from an energy computer program for both the “base-case” building and the one with the extra features. P Let S be the savings, the reduced energy cost attributable to the extra features over the year, in dollars per year. ESP3 Payback Time P The Simple Payback Time SPT is SPT = C/S P Since C is in $ and S is in $/yr, the units of SPT are years. P SPT is the time it takes for < dollar savings = extra costs of the energy-saving measures < assuming no change in energy prices over the years. P With a little effort and some complicated mathematics, you can figure out the effective payback time or discounted payback time in years, accounting for changes in the price of energy (and hence your yearly dollar savings) in the future. P As energy prices increase , your dollar savings do as well, and the payback time shortens . ESP4

  3. Return on Investment P Return on Investment (ROI) is the annual percentage rate of dollars earned, or in this case, saved, in response to an initial expenditure (the investment) P If C is the cost of the investment and S is the savings, both defined on slide 3, then the return on the investment is the ratio of the savings S each year to the initial investment C , expressed as a percent. ROI = 100% ( S / C ) P Note: ROI is 1/PBT times 100% P The shorter the payback time, the greater the economic return on the investment P The escalated return on investment takes account of changing future values, but a good straight ROI, as defined above, is still a good indicator of the return on the investment. ESP5 Cash Flow Analysis P With cash flow analysis, we assume that no money is directly invested in an energy-saving technology. P Instead money, the principle P , is borrowed at an interest rate I , and the dollar value of the energy savings is used to pay off the loan. P If the technology saves more than the loan payment, then the cash flow is positive each month (or each year). P If the technology saves less than the loan payment, then the cash flow is negative . P Alert business managers are easy to convince, if offered a technology they don’t pay for (the loan pays for it) which pays them a little extra each year. P When interest rates are low, or when energy prices are high, it is easier to have positive cash flow with such a scheme. ESP6

  4. Life-cycle Costs P Life-cycle cost analysis seeks to consider all the costs and benefits of an energy-saving technology over the lifetime of the equipment involved. P An investment is made. P There are annual maintenance and service costs to add in. P There are annual savings which may be subtracted from the costs. P The costs and savings are projected over the system’s lifetime. P The net, end-of-life, or life-cycle cost is totaled and compared with the life-cycle costs of alternative investments. P The least life-cycle cost technology is generally the one to use. P This approach is well-tailored to adding in a variety of societal and environmental costs associated with the investment, if dollar values can be placed on them . ESP7 Net Energy Analysis P Starts by estimating the total non-renewable energy costs to manufacture and install an energy-saving technology. P It estimates the amount of non-renewable energy saved over the lifetime of that technology. P If the energy savings exceed the energy costs to manufacture, i.e. if the net energy savings are positive then the investment is a good one. P The investment is good if less nonrenewable energy is spent than the technology saves in its lifetime. P Some renewable energy technologies are net energy losers by this measure ESP8

  5. External Costs P External costs are the environmental and human health costs of a business operation that are not included in the business’s profit and loss statement . P External costs are “off the books” and not considered a normal cost of doing business. P People and the environment pay external costs—in tax dollars to clean up messes and in health care dollars and diminished health. P External costs are not included in the price of a product . This sends misleading price signals to purchasers and perverts a free-market economy. P Internalizing costs is the process of pulling external costs back into the corporations generating them, forcing them to include them in their prices offered to customers. ESP9 Least-cost is a powerful driver Seeing the Big Picture P Choosing the least cost energy option is too prevalent: And can be environmentally disastrous. P One reason is relatively low energy prices. P Energy codes work, but only minimally, because they aren’t strict enough. P Markets often fail to see the bigger picture, until rather late in the game, especially if they are biased in the wrong direction by government policy (such as subsidizing fossil energy). P Let’s take a larger view .... ESP10

  6. Earth History Seeing the Really Big Picture Earth History Historical Earth Events Seeing the Big Picture -3 million yrs Multicellular organisms Age of Fossil Resources Coal: 250-350 million years Oil: 150 million years old (Approximate. Deposits Year 2000 Earth formed vary in age.) Vertebrates Life begins Dinosaurs Coal & oil formation -5 -4 -3 -2 -1 0 Time in billions of years ESP11 Human History Seeing the Really Big Picture Human History 6 Billion Oil deposit formations nearly complete Year 2000 World Population in Billions 6.0 800 million Year 1800 0 0 0 , 0 500 million 1 Year 1500 p 4.0 o P P o Y p e - : 1 a s 0 r n 3 m a 5 i m 0 l l i 0 o u n B h C 2.0 t s E 125,000 humans r i F 1 million yrs. ago 10,000 BCE 0.0 -3.0 -2.5 -2.0 -1.5 -1.0 -0.5 0.0 0.5 Time in millions of years ESP12

  7. History of Civilization History of Civilization 6 Billion (Oil is still being generated, but at the same very slow rate) Year 2000 year 1970 World Population in Billions 6.0 2.5 billion year 1950 Agriculture 800 million 4.0 year 1800 10 million people Year: 3500 BCE 500 million year 1500 2.0 0.0 -10 -8 -6 -4 -2 0 2 Time in thousands of years BCE ESP13 Exponential Growth ESP14

  8. Exponential growth of world oil and coal production What do you think Coal and oil 40 yrs happened in the next 40 years? And what will happen Coal 40 years after that? 40 yrs 1820 1840 1860 1880 1900 1920 1940 1960 1980 2000 M. King Hubbert, “The Energy Resources of the Earth,” Scientific American , September 1971, pp. 60-70. ESP15 The Future of Oil Production C. J. Campbell and J. H. Laherrere, “The End of Cheap Oil,” Scientific American , March 1998, pp. 78-83. ESP16

  9. The Peaking of U.S. Oil Production A massive failure of policy P The U. S. peaked its production of oil in 1972. P Thereafter we turned to other countries to make up the shortfall. P We had a very unique opportunity in 1972 to initiate a crash program to convert to energy conservation and renewable energy sources. P We missed that opportunity. P And now we import more oil than any other nation on earth. P When will world oil production reach its peak? ESP17 The Peaking and Decline of World Oil U. S. production peaked in 1972, only 3 years after 1969, the year Hubbert predicted (in 1956) it would happen. C. J. Campbell and J. H. Laherrere, “The End of Cheap Oil,” Scientific American , March 1998, pp. 78-83. U. S. peak World 1972 peak ESP18

Download Presentation
Download Policy: The content available on the website is offered to you 'AS IS' for your personal information and use only. It cannot be commercialized, licensed, or distributed on other websites without prior consent from the author. To download a presentation, simply click this link. If you encounter any difficulties during the download process, it's possible that the publisher has removed the file from their server.

Recommend


More recommend