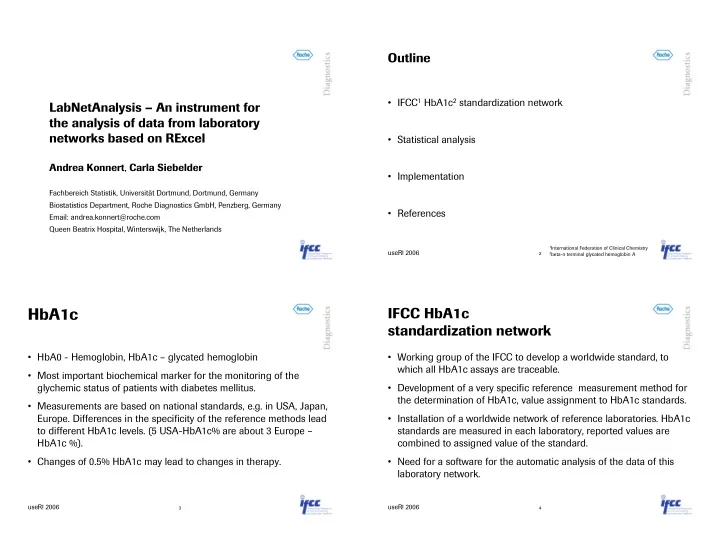

Outline • IFCC 1 HbA1c 2 standardization network LabNetAnalysis – An instrument for the analysis of data from laboratory networks based on RExcel • Statistical analysis Andrea Konnert , Carla Siebelder • Implementation Fachbereich Statistik, Universität Dortmund, Dortmund, Germany Biostatistics Department, Roche Diagnostics GmbH, Penzberg, Germany • References Email: andrea.konnert@roche.com Queen Beatrix Hospital, Winterswijk, The Netherlands 1 International Federation of Clinical Chemistry useR! 2006 2 beta-n terminal glycated hemoglobin A 2 HbA1c IFCC HbA1c standardization network • HbA0 - Hemoglobin, HbA1c – glycated hemoglobin • Working group of the IFCC to develop a worldwide standard, to which all HbA1c assays are traceable. • Most important biochemical marker for the monitoring of the glychemic status of patients with diabetes mellitus. • Development of a very specific reference measurement method for the determination of HbA1c, value assignment to HbA1c standards. • Measurements are based on national standards, e.g. in USA, Japan, Europe. Differences in the specificity of the reference methods lead • Installation of a worldwide network of reference laboratories. HbA1c to different HbA1c levels. (5 USA-HbA1c% are about 3 Europe – standards are measured in each laboratory, reported values are HbA1c %). combined to assigned value of the standard. • Changes of 0.5% HbA1c may lead to changes in therapy. • Need for a software for the automatic analysis of the data of this laboratory network. useR! 2006 useR! 2006 3 4
Analysis Flow Production of primary calibrators Data from the production • Calculation of Assigned values and process of assigned values uncertainty of primary calibrators. and uncertainty primary calibrators Measurement of Measurement of secondary secondary calibrators within Identification of mayor calibrators within 3 national standardization networks. each network laboratory. uncertainty sources. Data sheets from Data sheet from each network. each laboratory. Different data sources • Calculation • Approval of and formats. of assigned laboratories values • Outlier Identification • Calculation of Standardization of data assigned values input. and uncertainty Assigned values of secondary calibrators based on national stand. networks • Method Assigned values and comparison studies uncertainty of • Stability checks secondary calibrators Data in Calculations Results of Excel in R stability checks useR! 2006 useR! 2006 5 6 Standardized input and output sheet Approval of laboratories • Laboratories, being members of the network need to be controlled, candidate laboratories need to be approved. • Comparison of the measured values of the respective laboratory of multiple samples with the values of the other laboratories. • Random coefficient model, based on the lab-specific values, versus the overall median of each sample. Estimation of lab-specific intercept and slope. • Estimated lab-specific intercept and slopes will naturally differ in a certain range, differences above this threshold are not accepted. useR! 2006 useR! 2006 7 8
Approval of laboratories Approval of laboratories Creation of Graphics in Excel Calculation of Coordinates in R • Based on historical data, a confidence ellipse, representing the natural variation of intercept and slope was derived. Laboratories outside this ellipse are not approved. useR! 2006 useR! 2006 9 10 Implementation Master data handling • Analysis functions are written in R, summarized in an R Package. • For some parts of the analysis master data is needed, e.g. data • Input and output sheets are specified by the network coordinator. derived from previous studies. • Link between R and Excel via RExcel and VBA. – For example the shape of the ellipse for laboratory approval • Input of this data over Excel sheet, saving of the data in .RData files in specified folder. • During the analysis this data is imported by R. Example useR! 2006 useR! 2006 11 12
User handling Conclusions • Specification of folders with • The connection between R and Excel, by RExcel, provides a good – Data of the primary calibrators interface to meet the requirements of end-user and statistician for routine-fashioned data analysis. – Data of the IFCC laboratories – Data of the DCM laboratories • Standardized data-handling, data-flow and reporting. – Master data files • User-friendly handling. • On one click the whole analysis is carried out. • Full repertoire of statistical methods, easy adaption of “development” function in R, to “production” functions. • Excel sheets with results and graphics are inserted in the respective file. useR! 2006 useR! 2006 13 14 References • Konnert A., Berding C., Arends S., et.al., Statistical rules for laboratory networks, JTEV, 32, 2006 • Konnert A., Arends S., Schubert S., et.al., Uncertainty calculation for calibrators of the IFCC HbA1c standardization network, Thank you. Accred.Qual.Ass., 2006 Many thanks to Erich Neuwirth and Thomas Baier. • http://www.cran.r-project.org/ • http://www.cran.r-project.org/ -> Others -> R DCOM COBAS, ACCU-CHEK, COAGUCHEK, MODULAR, ELECSYS, ROCHE OMNI, AMPLIPREP, TAQMAN, and LIFE NEEDS ANSWERS are trademarks of Roche. useR! 2006 useR! 2006 15 16
Recommend
More recommend