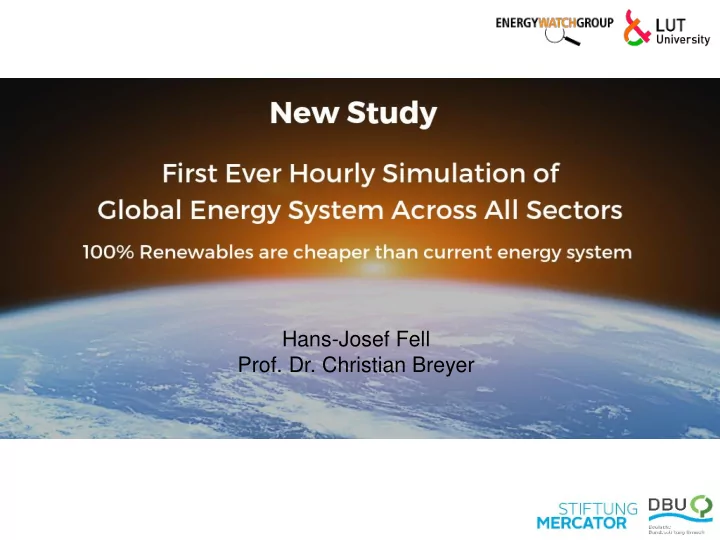
Hans-Josef Fell Prof. Dr. Christian Breyer Global GHG Emissions - - PowerPoint PPT Presentation

hans josef fell prof dr christian breyer
SMART_READER_LITE
LIVE PREVIEW

Hans-Josef Fell Prof. Dr. Christian Breyer Global GHG Emissions - - PowerPoint PPT Presentation

Hans-Josef Fell Prof. Dr. Christian Breyer Global GHG Emissions Must Come to Zero around 2030 to Reach the 1.5C Paris Target Delaying the peak by further 7 years gives too little time to transform the economy Peaking emissions by 2016


slide-1
SLIDE 1

Hans-Josef Fell

  • Prof. Dr. Christian Breyer
slide-2
SLIDE 2

Global GHG Emissions Must Come to Zero around 2030 to Reach the 1.5°C Paris Target

Peaking emissions by 2016 would have given us 25 years to reduce emissions to zero Delaying the peak by further 7 years gives too little time to transform the economy

slide-3
SLIDE 3

Largely domestic energy systems based on 100% renewables will create energy independence and support millions of local jobs in the energy sector. The energy transition is not a question

  • f technical feasibility or economic

viability, but one of political will.

New Study by EWG & LUT Shows:

100% renewable energy worldwide is more cost effective than the current energy system and leads to zero emissions before 2050.

slide-4
SLIDE 4

Primary energy source Solar Wind Biomass/ Waste Hydro Geo-thermal Share in 2050 69% 18% 6% 3% 2%

Solar and Wind Will Dominate the 100% Renewable World

slide-5
SLIDE 5
  • Feed-in-tariffs crucial until 40 MW

(GET-FiT)

  • Auctions for utility-scale projects
  • Abolish fossil and nuclear subsidies
  • Carbon, methane, radioactivity tax
  • Research, education & campaigning
  • Reducing licensing obstacles

Not successful:

  • Certificate

systems

  • Emission

trading

Policy Recommendations

slide-6
SLIDE 6

Global Overview

  • The world is structured into 9 major regions, which are further divided to 145 sub-regions
  • Some sub-regions represent more than one country, others parts of a larger country
  • The sub-regions are interconnected by power lines within the same country
  • The results shown are for the Power, Heat, Transport, Desalination sectors
  • The energy transition scenario is carried out in full hourly resolution for all energy sectors
  • In total 106 different technologies are applied
slide-7
SLIDE 7

Long-term Energy Demand

  • Final energy demand grows by 1.0% per year, while energy services grow faster
  • Broad electrification leads to only 0.5% per year in primary energy demand growth
  • World population grows from 7.2 billion (2015) to 9.7 billion (2050)
  • Substitution of inefficient combustion processes by electric solutions where possible
  • Processes of 2015 for energy services in 2050 would double primary energy demand
  • Fossil fuels are practically substituted by renewable electricity (mainly solar PV, wind)
slide-8
SLIDE 8

Energy System Costs

  • Levelised cost of energy decline from 54 €/MWh (2015) to 53 €/MWh (2050)
  • Fuel costs diminish through the transition period, while capital expenditures dominate
  • Costs are well spread across a range of technologies with major investments for solar PV, wind energy,

batteries, heat pumps and synthetic fuel conversion up to 2050

  • The cumulative investment costs are about 67,200 b€
slide-9
SLIDE 9

Electricity Supply and Storage

  • Electricity generation covers demand of all sectors
  • Solar PV supply increases from 32% in 2030 to about 73% in 2050

becoming main energy source

  • Wind energy very important in Northern hemisphere
  • Batteries store 92% of all to be stored electricity
  • Heat is mainly stored in thermal energy storage
  • Gas storage contributes around 39% of the heat storage output in

2050, mainly for seasonal demand

slide-10
SLIDE 10

Regional Variations

  • Solar PV dominates most of regions around the world and particularly in the Sun Belt
  • Wind energy drives systems in the Northern and Southern hemispheres with excellent wind conditions and

lacking seasonal solar energy

  • Some regions are further complemented with hydropower to form a mixed system
slide-11
SLIDE 11

Transport Sector

  • Transportation demand is assumed to triple till 2050
  • Final energy demand and energy cost remain stable, thanks to broad

electrification and low electricity cost

  • Fossil fuel costs are substituted by capital expenditures and some

sustainable biofuels

  • Liquid fuels (31%) and hydrogen (26%) produced by electricity

contribute substantially to the final energy demand in 2050, mainly for marine and aviation

slide-12
SLIDE 12

Greenhouse Gases Emissions

  • Greenhouse gases (GHG) emissions can be reduced from around 30,000 MtCO2eq in 2015 to zero by 2050

across all energy sectors

  • Remaining cumulative GHG emissions comprise ca. 422 GtCO2eq from 2018 to 2050
  • The presented 100% RE scenario is compatible with the Paris Agreement for 1.5⁰C
slide-13
SLIDE 13

Jobs Prospects – Power Sector

  • Total direct energy jobs are set to increase with the initial ramp up of installations from about 20 million

in 2015 to around 35 million by 2050

  • Loss of coal and other fossil fuel related jobs are more than compensated by new jobs
  • Solar PV emerges as the prime job creator with over 22 million jobs by 2050
  • Operation and maintenance jobs continue to grow through the transition period and become the major job

segment by 2050 with 50% of total jobs

slide-14
SLIDE 14

Key Aspects

  • 1.5°C scenario with zero GHG emissions in 2050
  • Specific energy cost shrink slightly
  • Broad electrification of the entire energy system
  • Energy services expand, while primary energy grow slowly
  • More renewable energy leads to more jobs
  • Solar photovoltaic, wind energy, batteries, heat pumps and synthetic fuel

conversion technologies are central

  • Methods used: full hourly and high geo-spatial resolution and cost optimisation

for applied constraints

  • No risk technologies required
  • Political will and ambitious execution drive transition
slide-15
SLIDE 15

For more information please visit: www.energywatchgroup.org Hans-Josef Fell fell@hans-josef-fell.de

  • Prof. Dr. Christian Breyer

christian.breyer@lut.fi The study was co-funded by: