h Loss pressure h 1 6 h Recovery pressure h 11 6 h - - PowerPoint PPT Presentation

h loss pressure h
SMART_READER_LITE
LIVE PREVIEW

h Loss pressure h 1 6 h Recovery pressure h 11 6 h - - PowerPoint PPT Presentation

E XPERIMENT (7) I NVESTIGATION OF B ERNOULLI T HEOREM By: 1 Eng. Motasem M. Abushaban. Eng. Fedaa M. Fayyad. P URPOSE Investigate Bernoulli Theorem. 2 A PPARATUS Bernoullis Apparatus 3 T HEORY Tapping 1 2 3 4 5 6 7 8 9 10


slide-1
SLIDE 1

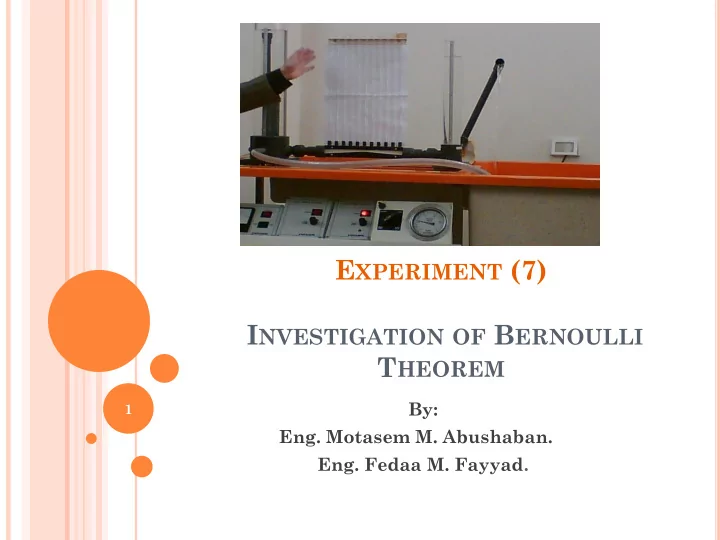
EXPERIMENT (7) INVESTIGATION OF BERNOULLI THEOREM

By:

  • Eng. Motasem M. Abushaban.
  • Eng. Fedaa M. Fayyad.

1

slide-2
SLIDE 2

PURPOSE

 Investigate Bernoulli Theorem.

2

slide-3
SLIDE 3

APPARATUS

3

Bernoulli’s Apparatus

slide-4
SLIDE 4

4

THEORY

Tapping Number 1 2 3 4 5 6 7 8 9 10 11 Flow Area (mm2) 102.56 90.11 77.66 65.22 52.77 40.32 52.77 65.22 77.66 90.11 102.56

t cons z g v g p tan 2

2

   

g p 

g v 2

2

: Pressure head z : potential head

: Kinetic head

slide-5
SLIDE 5

5

THEORY

6 11

pressure Recovery h h  

6 1

pressure Loss h h  

recovery pressure

  • f

degree

6 1 6 11

    h h h h R

pressure Recovery

slide-6
SLIDE 6

PROCEDURE

1.

Open the pump and let the water go through the apparatus until all the air bubbles leave.

2.

Set the difference between the tanks to 10 cm by using the arm beside the shorter tank.

3.

Close the valve of the basin and begin the stop watch to calculate Q.

4.

Repeat the previous steps with different differences between the two tanks ( 15 then 20 cm )

5.

Take the paper and connect every set of points with lines

6

slide-7
SLIDE 7

RESULT AND CALCULATION

7

 Record the results on a copy of the result sheet

provided.

 Calculate the flow rate for each set of results.  For each set of results calculate at the cross-

section adjacent to each manometer tube, the flow velocity.

 Plot a graph of head (H) against distance (S) and

also (H+V2/2g) against distance (S).

slide-8
SLIDE 8

8

QUESTIONS