Groundwater Recharge and Recovery by the Public Works Department - - PDF document

groundwater recharge and recovery
SMART_READER_LITE
LIVE PREVIEW

Groundwater Recharge and Recovery by the Public Works Department - - PDF document

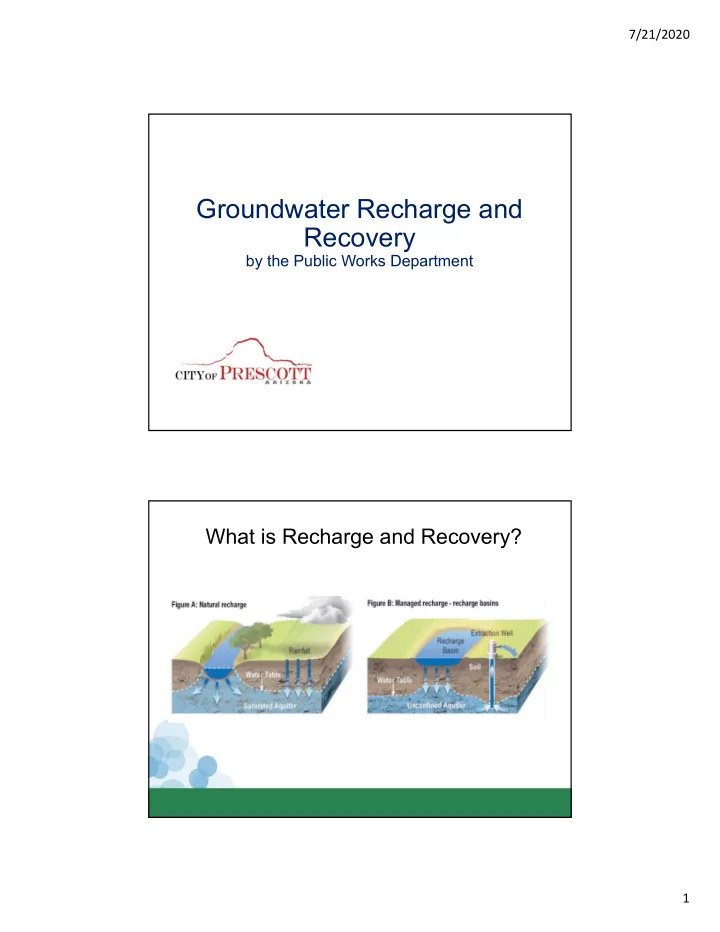
7/21/2020 Groundwater Recharge and Recovery by the Public Works Department What is Recharge and Recovery? 1 7/21/2020 Introduction to the Groundwater Recharge Facility The City operates an aquifer storage and recovery facility; the


slide-1
SLIDE 1

7/21/2020 1

Groundwater Recharge and Recovery

by the Public Works Department

What is Recharge and Recovery?

slide-2
SLIDE 2

7/21/2020 2

Introduction to the Groundwater Recharge Facility

The City operates an aquifer storage and recovery facility; the common name is a “Recharge Facility”

  • Recharges both surface

water and treated effluent supplies

  • Requires state permitting
  • Meets both the State and

City water management efforts for maintaining long-term groundwater supplies.

2015 Aerial, Low

Background – Recharge Supplies

  • Historically, the community’s wastewater supplies were treated/reclaimed,

and then used to irrigate Antelope Hills Golf Course. This golf course dates back to the 1950s.

  • When more reclaimed supplies were available than were needed at the

golf course, then those volumes prior to 1987 were discharged to Granite Creek (until approximately 1988).

  • In 1988, the City was issued its first “Recharge Project Permit” from the

State of Arizona for underground storage of treated effluent (a recharge facility). The facility was approved for 6,721 acre-feet per year.

  • In 1998, the City was issued two water storage permits.

4

slide-3
SLIDE 3

7/21/2020 3

  • In 2009, the City was issued a modified permit allowing for the recharge of

7,200 acre-feet per year.

  • In 2013, the City was issued a modified permit allowing for the recharge of

12,000 acre-feet per year.

  • The City continues to operate the recharge facility in the location that was

first permitted in 1988.

Background – Recharge Supplies (cont.)

5

Water Pumped vs. Wastewater Returned Comparison

Year Water Pumped Wastewater Returned % Returned 2019 6855.06 4297.42 63% 2018 6733.18 4113.33 61% 2017 6734.86 4438.04 66% 2012 6725.31 3831.98 57% 2005 7838.5 4728.5 60% 2004 8054.5 4083.3 51% 2003 8091.6 3751.81 46%

slide-4
SLIDE 4

7/21/2020 4

Yearly Recharge Volumes from 2006 - 2018 Questions