
SLIDE 1
Green Roof Opportunities Bruce Gregoire M.S. University of - - PowerPoint PPT Presentation
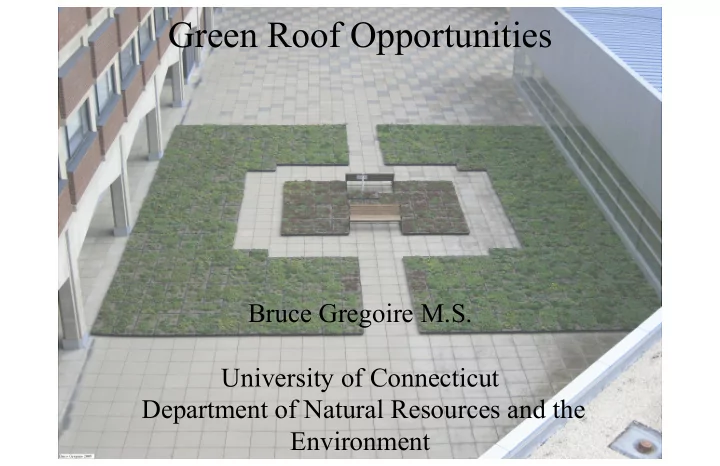
Green Roof Opportunities Bruce Gregoire M.S. University of Connecticut Department of Natural Resources and the Environment Outline Background Green roofs Objectives Methods Results Conclusions Future research needs
Background Green roofs Objectives Methods Results Conclusions Future research needs
(Booth and Jackson, 1997; Lombardo et al., 2000; Makepeace et al., 1995; Novotny and Olem, 1994; USEPA, 2009)
(Bannermann et al., 1993; Boulanger and Nikolaidis, 2003; Forster, 1996)
Bishop Center
Green roof
ZinCo Int, 2007
Figure 1. Meta-analysis of green roof precipitation retention. The solid vertical line represents an average retention of 56%.
(Clausen and Spooner, 1993)
334 modules 81%
2.6% organic
Slow release
Growth media Concrete pavers Weed block Roof structure Module Drainage holes Root barrier/ Filter fabric
Calibration Period (n=29) Characteristic Control Treatment Calibration Equation Adjusted runoff (cm wk-1) 0.55 0.67 T=1.23C0.78 C = Control T = Treatment Treatment Period (n=18) ANCOVA Control Treatment Predicted Treatment Observed % Change F p 1.44 1.63 1.07
63.81 <0.001
1September 2009 to June 2010
Figure 1. Meta-analysis of green roof precipitation retention. The solid vertical line represents an average retention of 56%.
TN (mg L-1)
0.1 1
Control Green roof Precipitation
b a a
n = 19
NH3-N (mg L-1)
0.0001 0.001 0.01 0.1 1
Control Green roof Precipitation
a a b
n = 19
TP (mg L-1)
0.0001 0.001 0.01 0.1 1
Control Green roof Precipitation
c b a
n = 19
PO4-P (mg L-1)
0.0001 0.001 0.01 0.1 1
Control Green roof Precipitation
c b a
n = 19
Zn (µg L-1) Dissolved
1 10 100
Control Green roof Precipitation
c a b
n = 14
NH3-N NO3+NO2-N
PO4-P
Alsup, S., Ebbs, S., Retzlaff, W., 2010. The exchangeability and leachability of metals from select green roof growth substrates. Urban Ecosyst. 13:91-111. Bannerman, R.T., Owens, D.W., Dodds, R.B., Hornewer, N.J., 1993. Sources of pollutants in Wisconsin stormwater. Water Sci. Technol. 28:241-259. Berndtsson, J.C., Emilsson, T., Bengtsson, L., 2006. The influence of vegetated roofs on runoff water quality. Sci. Total Environ. 355:48-63. Berndtsson, J.C., Bengtsson, L., Jinno, K., 2009. Runoff water quality from intensive and extensive vegetated roofs. Ecol. Eng. 35:369-380. Berghage, R.D., Beattie, D., Jarrett, A.R., Thuring, C., Razaei, F., O’Conner, T.P., 2009. Green roofs for stormwater runoff control. EPA 600-R-09-026. National Risk Management Research Laboratory Office of Research and Development U.S. Environmental Protection Agency. Cincinnati, OH. Booth, D.B., Jackson, C.R., 1997. Urbanization of aquatic systems: Degradation thresholds, stormwater detection, and limits of mitigation. J. Am. Water Resour. Assoc. 33(5): 1077-1090. Boulanger, B., Nikolaidis, N.P., 2003. Mobility and aquatic toxicity of copper in an urban watershed. J. Am. Water Resour. Assoc. 39:325-326 Carter, T.L., Rasmussen, T.C., 2005. Use of green roofs for ultra-urban stream restoration in the Georgia Piedmont (USA). In Proc. Of Third North American Green Roof Conference: Greening Rooftops for Sustainable Communities, Washington D.C. Clausen, J.C., Spooner, J., 1993. Paired watershed study design: EPA-841-F-93–009, Office of Water, Washington, DC.DeNardo, J.C., Jarrett, A.R., Manbeck, H.B., Beattie, D.J., and Berghage, R.D., 2005. Stormwater mitigation and surface temperature reductions by green roofs. ASAE. 48(4):1491-1496. Emilsson, T., Berndtsson, J.C., Mattsson, J.E., Rolf, K., 2007. Effect of using conventional and controlled release fertilizer on nutrient runoff from various vegetated roof
Förster, J., 1996. Patterns in roof runoff contamination and their implications on practice and regulation of treatment and local infiltration. Water Sci. Technol. 33:39-48. Hathaway, A.M., Hunt, W.F., Jennings, G.D. 2008. A field study of green roof hydrologic and water quality performance. Trans. ASABE 51:37-44. Hutchinson, D., Abrams, P., Retzlaff, R., Liptan, T., 2003. Stormwater monitoring two ecoroofs in Portland, Oregon. Paper presented at the First Annual Greening Rooftops for Sustainable Communities Conference, Awards and Trade Show. Chicago, IL. Lombardo, L.A., Grabow, G.L., Spooner, J., Line, D.E., Osmond, D.L., Jennings G.D., 2000. Section 319 Nonpoint Source National Monitoring Program Successes and
Köhler, M., Schmidt, M., Grimme, F.W., Laar, M., de Assunção Paiva, V.L., Tavares, S., 2002. Green roofs in temperate climates and in the hot-humid tropics - far beyond the
Liptan, T., Strecker, E., 2003. EcoRoofs (Greenroofs) – A more sustainable infrastructure. In: Proc. of the National Conference on Urban Stormwater: Enhancing Programs at the Local Level, Chicago, IL. February 17-20, 2003. MacMillan, G., 2004. York University rooftop garden stormwater quantity and quality performance monitoring report. In Proc. of Second North American Green Roof Conference: Greening Rooftops for Sustainable Communities, Portland. OR. Makepeace, D.K., Smith, D.W., Stanley, S.J., 1995. Urban stormwater quality: Summary of contaminant data. Critical Reviews in Environ. Sci. Technol. 25(2):93-139. Monterusso, M.A., Rowe, D.B., Rugh, C.L., Russell, D.K., 2004. Runoff water quantity and quality from green roof systems. Acta Horticulturae. 639:369-376. Novotny, V., Olem, H., 1994. Water quality prevention, identification, and management of diffuse pollution. Van Norstrand Reinhold, New York. Spolek, G., 2008. Performance monitoring of three ecoroofs in Portland, Oregon. Urban Ecosyst. 11:349-359. Steusloff, S., 1998. Input and output of airborne aggressive substances on green roofs in Karlsruhe. Urban Ecology. J. Breuste, H. Feldmann, O. Uhlmann (Eds.). Springer- Verlag Berlin, Germany. Stovin, V., 2009. The potential of green roofs to manage urban stormwater. Water Environ. J. 23(3):1-8. In print. Teemusk, A., Mander, Ü., 2007. Rainwater runoff quantity and quality performance from a greenroof: The effects of short term events. Ecol. Eng. 30:271-277. USEPA, 1983. Results of the nationwide urban runoff program. United States Environmental Protection Agency, NTIS PB84-18552. USEPA, 2000. Guidance for data quality assessment. Practical methods for data analysis. EPA QA/G-9. EPA 600-R-96-084, Office of Environmental Information, Washington, D.C. USEPA, 2007. National water quality inventory: 2002 Report. EPA-841-R-07-001. Office of Water. Washington, D.C. USEPA, 2009. National Water Quality Inventory: 2004 Report. EPA-841-R-08-001. Office of Water, Washington, D.C. VanWoert, N.D., Rowe, D.B., Anderson, J.A., Rugh, C.L., Fernandez, R.T., Xiao, L., 2005. Green roof stormwater retention: Effects of roof surface, slope, and media depth. J.