Green Mountain Power A vertically integrated Utility We serve - - PowerPoint PPT Presentation

green mountain power a vertically integrated utility
SMART_READER_LITE
LIVE PREVIEW

Green Mountain Power A vertically integrated Utility We serve - - PowerPoint PPT Presentation

Green Mountain Power A vertically integrated Utility 
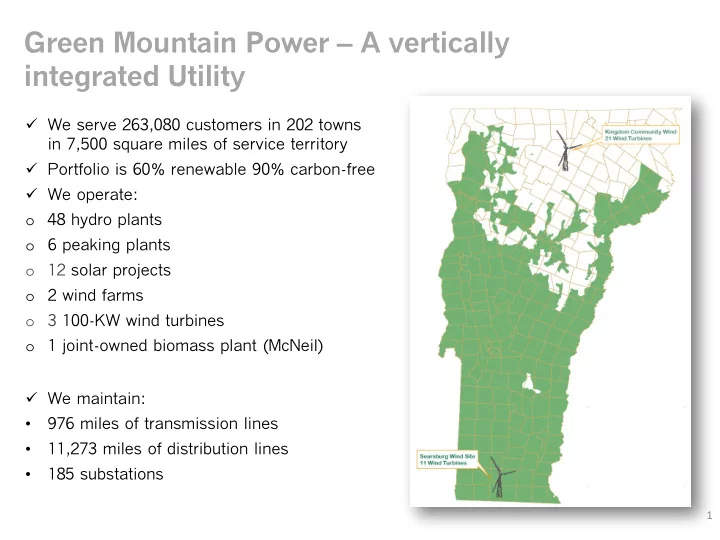
We serve 263,080 customers in 202 towns in 7,500 square miles of service territory Portfolio is 60% renewable 90% carbon-free We operate: 48 hydro plants o 6 peaking plants o


slide-1
SLIDE 1

Green Mountain Power – A vertically integrated Utility

 We serve 263,080 customers in 202 towns in 7,500 square miles of service territory  Portfolio is 60% renewable 90% carbon-free  We operate:

  • 48 hydro plants
  • 6 peaking plants
  • 12 solar projects
  • 2 wind farms
  • 3 100-KW wind turbines
  • 1 joint-owned biomass plant (McNeil)

 We maintain:

  • 976 miles of transmission lines
  • 11,273 miles of distribution lines
  • 185 substations

1

slide-2
SLIDE 2

20 MW July 2015 230 MW July 2018 (>300 + queue)

slide-3
SLIDE 3

ALL ACTIVE SOLAR SOLAR <150 KW

3

slide-4
SLIDE 4

ACTIVE SOLAR IN MONTPELIER DISTRICT

4

slide-5
SLIDE 5

INTERCONNECTION PROCESS

5

slide-6
SLIDE 6

GMP SOLAR MAP

Distribution Challenges

6

slide-7
SLIDE 7

GMP SOLAR MAP (MONTPELIER)

7

slide-8
SLIDE 8

BLUE CUT FIRE

Bulk system challenges

8

slide-9
SLIDE 9

INDUSTRY RESPONSE

 UL 1741 SA (2016) Tests and certifies Grid Support functions – an intermediate step  IEEE 1547 (2018) Requires new Grid Support functions  IEEE 1547.1 (under ballot) describes the tests used to certify the new abilities from 1547 (2018) and is intended to replace UL 1741  ISO NE (2018) issues the Source Requirements Document for inverters (SRD) which utilize the new Grid Support functions following a national

  • tend. See California (Rule 21) and Hawaii (Rule 14)

9

slide-10
SLIDE 10

GLOBAL CHALLENGES

Intergovernmental Panel on Climate Change (2018)

World governments party to the Paris Agreement requested a comprehensive report on the impacts

  • f 1.5*C of global warming, and how

best to limit warming The report assessed more than 6,000 scientific papers, with input from 91 authors and editors from 40 countries Utilities need to think differently about electric delivery in the future

10

slide-11
SLIDE 11

EXTREME WEATHER EVENTS

Why do we need more resilient systems?

11

slide-12
SLIDE 12

12

MORE SEVERE STORMS

… exacerbated by climate change

May 2018 (shoulder month) windstorm, 3 day event, 995 events, 58,214 lost power

12

slide-13
SLIDE 13

RENEWABLE ENERGY STANDARD (RES)

Utility Transformation & Vermont Statute (Act 56)

13

slide-14
SLIDE 14

GMP ENERGY PROFILE: 60% RENEWABLE, 90% CARBON FREE

GMP Energy Sources – 2018* GMP Energy Sources - 2011

* Pre REC sales

14

slide-15
SLIDE 15

ENERGY TRANSFORMATION (TIER 3)

 Vermont’s RES requires fossil fuel reduction in transportation, thermal, business processing  Utilities can offer incentives to support projects and equipment replacement  GMP collaborates with EVT to maximize the cost-effectiveness and efficiency of customer initiatives

Utility of the Future

Residential Opportunity

  • Heat Pumps
  • Heat Pump Hot Water Heaters
  • Smart Thermostats
  • Battery Storage
  • Electric Vehicles

Commercial and Industrial Opportunities

  • Line Extensions to offset FF

Generation

  • Manufacturing Processes
  • Refrigeration
  • Transportation
  • Space and water heating

15

slide-16
SLIDE 16

What is GMP Doing?

Energy Storage Electric Vehicle Programs Controllable Loads & Heat Pumps

slide-17
SLIDE 17

Electricity and Delivery Model is Changing

Historical Utility Delivery Customer Energy Service Providers Policy and technology are shrinking the distance between supply and demand of electricity. Traditional utilities are losing customer

  • relationships. The utility of the future should

endeavor to provide these services.

17

slide-18
SLIDE 18

SOLAR & STORAGE – MANAGING PEAK

slide-19
SLIDE 19

GRID TRANSFORMATION – POWERWALL 2.0

As of November 6, 2018

1856 Powerwalls under contract 912 Batteries installed Now 4.3 MW of dispatchable peak

value

2018 ISO Peak occurred on August

29th

Powerwalls deployed 3.0MWs

during the peak hour

Worth $370,000 in peak value for

that one hour

Resiliency from the ground up

19

slide-20
SLIDE 20

QUESTIONS ?