
SLIDE 1
Green Matters Inc.
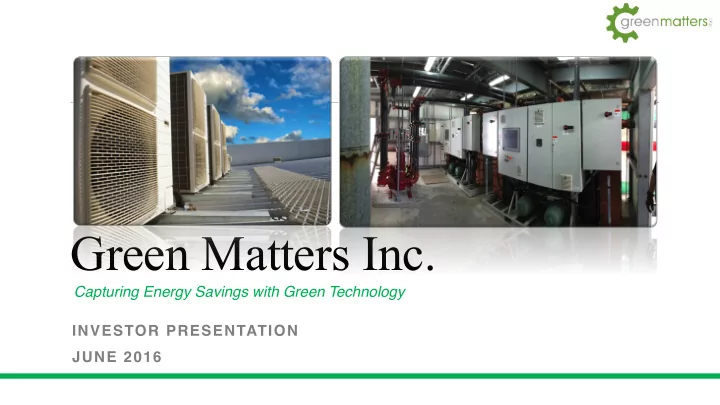
INVESTOR PRESENTATION JUNE 2016 Capturing Energy Savings with Green Technology
Green Matters Inc. Capturing Energy Savings with Green Technology - - PowerPoint PPT Presentation
Green Matters Inc. Capturing Energy Savings with Green Technology INVESTOR PRESENTATION JUNE 2016 Forward Looking Statements This presentation contains forward-looking statements. These forward looking statements are not based on historical
INVESTOR PRESENTATION JUNE 2016 Capturing Energy Savings with Green Technology
This presentation contains forward-looking statements. These forward looking statements are not based on historical facts but rather on Company management expectations regarding future growth, results of operations, performance, future capital and other expenditures (including the amount, nature and sources of funding thereof), competitive advantages, business prospects and opportunities. Statements in this presentation about future plans and intentions, results, level of activity, performance, goals or achievements or other future events constitute forward looking statements. Wherever possible, words such as “anticipate”, “believe”, “expect”, “may”, “could”, “will”, “forecast”, “potential”, “intend”, “estimate”, “should”, “plan”, “predict” or the negative or other variations of statements reflect managements’ current beliefs and assumptions and are based on information currently available to the Company management. Certain risk factors may cause actual results, level of activity, performance or achievements to differ materially from those implied by forward looking statements. These factors should be considered carefully and prospective investors should not place undue reliance on the forward looking statements. Although the forward looking statements contained in this presentation are based upon what the Company management believes to be reasonable assumptions, investors cannot be assured that actual results will be consistent with these forward looking statements. These forward looking statements are made as of the date of this presentation, and the Company assumes no obligation to update or revise them to reflect new events or circumstances.
2
Hotel in Puerto Rico in November 2014
founders and private placements $7.0 million+ from private investors
3 3
energy
temperature
to a higher temperature
4
5
commercial/residential hi-rises
performance (“COP”) of 550 to 580%
6
The 150-ton HRWH model
Data from initial sales to Marriott indicate 65% to 74% savings on the hotel’s water heating bill, an average monthly savings of $10,000 - $20,000 USD
demonstration showcase
testing, and storage
7
Initial focus on metropolitan cities in warmer climates:
8
9
billion in 2015 and expected to grow to US $52.6 billion by 2021
2014, forecasted to grow to US$108.93 billion by 2020
billion to US$150 billion a year
from generating heat energy
electricity needs
*Sources available upon request
compounded annual growth rate of 4.9% from 2015 to 2021
energy smart technologies spent in the US since 2007
10
*Sources available upon request
South America, Middle East, and Asia
warm climates
residential, office, and industrial markets
11
Michael Caetano – Chief Executive Officer, Director
founding and managing new companies
funding for private and public companies
Sean Marte, Chief Technical Engineer
test engineer for several manufacturing companies
Professional Engineers and Geoscientists of British Columbia
12
Michael Waldkirch, Chief Financial Officer
services to a wide variety of public and private companies
Accountants in since 1998
and high tech companies listed on the TSX-V, NYSE-MKT and OTC-BB
13
Ross McCutcheon, Director
37 years of experience catering to entrepreneurs.
14
TBD
15
16
Companies operating in the HVAC industry trade on average at an EBITDA multiple of 11.01x
Market Enterprise TTM TTM TTM TTM EV / EV / EV/ EV / Company Name Ticker Exchange Capitalization Value (EV) Revenues EBITDA Net Income Cash Flow Revenues EBITDA Net Income Cash Flow
AOS NYSE $5,704.9 $5,308.7 $2,540.0 $462.1 $282.9 $344.4 2.1 11.5 18.8 15.4 Watsco Inc. WSO NYSE $3,976.0 $4,432.5 $4,110.0 $355.7 $172.9 $221.4 1.1 12.5 25.6 20.0 United Rentals, Inc. URI NYSE $5,598.3 $13,581.3 $5,820.0 $1,800.0 $585.0 $2,000.0 2.3 7.5 23.2 6.8 Modine Manufacturing Company MOD NYSE $527.8 $603.9 $1,370.0 $102.0
$84.8 0.4 5.9 N/A 7.1 Watts Water Technologies, Inc. WTS NYSE $1,533.2 $1,814.3 $1,470.0 $114.3
$109.4 1.2 15.9 N/A 16.6 Mueller Industries, Inc. MLI NYSE $1,682.2 $1,655.8 $2,100.0 $161.8 $87.9 $159.6 0.8 10.2 18.8 10.4 Continental Materials Corporation CUO NYSE $19.4 $25.1 $135.0 $3.2
0.2 7.9 N/A N/A EnviroStar, Inc. EVI NYSE $22.8 $18.3 $29.6 $2.1 $1.3 $0.6 0.6 8.8 14.5 29.0 Graham Corporation GHM NYSE $195.3 $123.1 $105.2 $16.4 $9.8 $20.9 1.2 7.5 12.6 5.9 AAON, Inc. AAON NASDAQ $1,485.4 $1,477.5 $358.6 $83.4 $45.7 $52.9 4.1 17.7 32.3 27.9 Lennox International Inc. LII NYSE $6,043.0 $6,748.4 $3,470.0 $429.2 $187.2 $331.2 1.9 15.7 36.0 20.4 In Millions of US Dollars
Average
1.38 11.01 22.74 15.95
Median
1.12 10.23 21.03 16.00
Coefficient of Variance
0.80 0.36 0.36 0.53
17 FY 2016 FY 2017 FY 2018 FY 2019 FY 2020 FY 2021 Revenue $2,001,800 $12,036,900 $16,106,200 $32,235,200 $48,477,600 $81,705,400 Gross Margin $1,701,590 $10,232,595 $13,693,810 $27,407,760 $41,221,880 $69,479,770 Opera?ng Expenses $1,459,548 $5,047,404 $6,656,258 $10,933,753 $14,601,040 $20,551,517 Net Income
$12,190,765 $19,699,422 $36,206,907 Net Profit Margin
31.9% 32.3% 37.8% 40.6% 44.3%
0.0% 5.0% 10.0% 15.0% 20.0% 25.0% 30.0% 35.0% 40.0% 45.0% 50.0%
$0 $10,000,000 $20,000,000 $30,000,000 $40,000,000 $50,000,000 $60,000,000 $70,000,000 $80,000,000 $90,000,000 C$
Fiscal Years Ended December 31
18
Seeking funding of up to $5.0 million
Facility and Showroom Set-up $600,000 Equipment for Test Loop and Showcase $200,000 Testing, Patents and Certifications $90,000 Parts Inventory $150,000 Inventory Build-up $675,000 Redesign and Engineering $210,000 Marketing and Promotion $1,390,000 Wages & Benefits $400,000 General Working Capital $1,285,000 Total $5,000,000
Use of Proceeds
energy savings
climate countries
19
For further information, please contact: Michael Caetano mcaetano@greenmattersinc.com www.greenmattersinc.com
20