
SLIDE 1
Greek Shipping : Greece’s steaming force
1
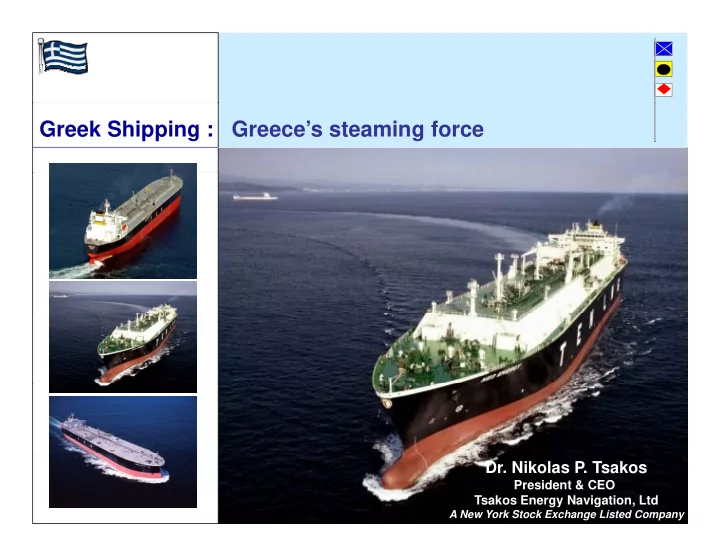
- Dr. Nikolas P. Tsakos
President & CEO Tsakos Energy Navigation, Ltd
A New York Stock Exchange Listed Company
Greek Shipping : Greeces steaming force Dr. Nikolas P. Tsakos - - PowerPoint PPT Presentation
Greek Shipping : Greeces steaming force Dr. Nikolas P. Tsakos President & CEO 1 Tsakos Energy Navigation, Ltd A New York Stock Exchange Listed Company WORLD FLEET WORLD FLEET by the nationality of owner by the nationality of owner
1
President & CEO Tsakos Energy Navigation, Ltd
A New York Stock Exchange Listed Company
COUNTRY DWT POPULATION DWT/PRS
1 GREECE
190 11 17,30
2 CYPRUS
9 0,863 10,43 WORLD FLEET BY THE NATIONALITY OF OWNER , ,
3 NORWAY
40 5 8,00
4 SINGAPORE
32 4 8,00
5 DENMARK
33 5,5 6,60
6 HONG KONG
34 7 4,90
7 U.A.E.
5 3 1,66
8 JAPAN
183 128 1,43
9 GERMAN
103 82 1,26
10 CHINA (TAIWAN)
29 23 1,26
11 BELGIUM
12 11 1,10
12 S. KOREA
45 49 0,92
13 CANADA
18 33 0 55
13 CANADA
18 33 0,55
14 NETHERLANDS
9 17 0,53
15 SWITZERLAND
4 8 0,50
16 SAUDI ARABIA
13 27 0,48
17 U.K.
26 60 0,43
18 MALAYSIA
12 28 0 43
18 MALAYSIA
12 28 0,43
19 ITALY
22 60 0,37
20 TURKEY
16 75 0,21
21 IRAN
13 74 0,18
22 U.S.A.
41 310 0,13
23 RUSSIA
19 142 0,13 RUSSIA 19 142 0,13
24 FRANCE
7 64 0,11
25 CHINA
104 1.500 0,07
26 BRAZIL
8 191 0,04
27 INDONESIA
9 230 0,04
28 INDIA
17 1.200 0,01
30000 25000 30000
15000 20000 ions US$ millions us $
5000 10000 milli
5000 1960 1970 1980 1990 2000 2001 2002 2003 2004 2005 2006 2007 2008 2009 2010 2011
3
2000-2011 shipping contributed 154bn euro in foreign exchange earnings to the Greek Economy
13 billion
490 vessels equals 50 m dwt 128 tankers 20% of world tonnage 296 b lk 13% f ld
96 billion
4
296 bulkers 13% of world tonnage
Merchant Fleets of the EU in million dwt
5
December 2011
Scale & Diversified Operations
Crude Crude Product Product LNG LNG
Empire State Empire State VLCC VLCC Suezmax Suezmax Aframax Aframax Panamax Panamax Handymax Handymax Handysize Handysize Aframax Aframax LNG LNG
8
Empire State Empire State 1,250 1,250 VLCC VLCC 1,100 1,100 300,000dwt 300,000dwt Suezmax Suezmax 900 900 150,000dwt 150,000dwt Aframax Aframax 850 850 100,000dwt 100,000dwt Panamax Panamax 750 750 70,000dwt 70,000dwt Handymax Handymax 615’ 615’ 50,000dwt 50,000dwt Handysize Handysize 570’ 570’ 37,000dwt 37,000dwt 3 12 8 9 6 8 Aframax Aframax 850 850 100,000dwt 100,000dwt 3 LNG LNG 750 750 85,000dwt 85,000dwt 1
Corporate Highlights – Value Proposition
18 years of profitable operations Public markets experience: 1993-2005 Oslo Stock Exchange, 2002 New York Stock Exchange Since NYSE listing in 2002: Average ROE 21% pa, accumulated Net Income of over $1bn => Total Capital Gains at $280 million HISTORY p Total Dividends of $340 million paid since NYSE listing (2Q 2002) – approx. $1/share average dividend per year $9.075/share in total dividends against an IPO price of $7.50/share (in 2002) Growth: 4 ships in 1993 – 50 today SCALE One of the largest transporters of energy in the world Carried 405m barrels of oil in 2010 – the equivalent of about 37 days of current US imports 50 vessels of 5.4 million dwt (proforma): 23 crude oil carriers + 27 product tankers (incl. one LNG vessel) 48 operating 2 d i 2 under construction Modern diversified fleet: 100% double hull vs. 93% of world fleet – 6.8 yrs average age vs. 8.5 of world fleet $3.2 billion investment in 57 newbuildings since 1997 One of the largest ice-class owners in the world (21 ice-class vessels)
VALUE PROPOSITION
9
Hidden Value of TNP stock vs. Actual Market
In USD mill SUEZMAX AFRAMAX
Market Cap: $230m Share price at 11/01/11: $5.00 52 wk High (03/22/11): $11 18 50 45
In USD mill SUEZMAX AFRAMAX
52-wk High (03/22/11): $11.18 52-wk Low (11/29/11): $4.84 Discount/Analyst NAV: 40-50% 40
Actual Value Hidden value $23.0m per vsl
35 45
e … Hidden value $17.5m per vsl
25 30
Actual Value
Continues profitability Average ROE since 2002: 21%
are Value…
10 15 20 Consistent dividends Versatile / flexible employment Active in Sales & Purchase
Based Based on Sh
5 10
Attractive comparison to peer group
10
Pentathlon/Decathlon Sale Price: $51.5m each Total Capital Gains: $6.0m Free Cash: $101m Total ROI: 56.0% Parthenon / Marathon Sale Price: $39.0m each Total Capital Gains: $14.2m Free Cash: $19.4m Total ROI: 88.2%
Virtual Reality…..Valuation Imbalance
The stock market ascribes no value to th h lf f
more than half of TEN’s fleet…
Equity value of TEN as of 12/31/10: $1.0 billion Market Cap today: $227 million Market values TNP as a 15-vessel company – 35 modern vessels at NO value * Real market values as of 30/09/11 Stock market values as of 30/09/11 LNG $200m $66m
1
11
Suezmax $48m $16m Aframax $37m $12m Product $30m $10m
11 23 12
*All based on Clarkson's 5 year vessels
Continuous Dividend Payments
On June 4th, 2010 the Board of Directors declared a change in TEN’s dividend policy from semi-annual to quarterly payments
Since initiation of dividend payments and including the recently announced quarterly payment, TEN has distributed a total of $9.075 per share to its shareholders (IPO price, split adjusted: $7.50) The basis of dividends will continue to target a payout ratio of 25% to 50% of net income subject to maintaining an appropriate level of liquidity as a function of a prudent and strong financial position
$0 90 $0.85$1.4 $1.6 $1.8
Semi-annual distributions
$0.48 $0.55 $0.75 $0.90 0.15$0.6 $0.8 $1.0 $1.2
$0.25 $0.25 $0.35 $0.50 $0.63 $0.83 $0.90 $0.30 $0.15 $0.15 $0.10 $0.25 $0.30 $0.15 $0.15 $0.15$0.0 $0.2 $0.4 2002 2003 2004 2005 2006 2007 2008 2009 2010 2011 1st 2nd 3rd 4th
12
13
=> Accumulated Net Income since NYSE listing at $1 billion December 2011 50 vessels
5 6
5.4m dwt
3 4 t (in mill)
March 2002 26 vessels 2.3m dwt
1 2 Dwt
October 1993 4 vessels 0.2m dwt
14
1
1993 1994 1995 1996 1997 1998 1999 2000 2001 2002 2003 2004 2005 2006 2007 2008 2009 2010
Modern & Diversified Fleet
CRUDE TANKERS CLEAN / PRODUCT TANKERS CRUDE TANKERS Dwt Built Hull Ice Class
VLCC
1
Millennium 301,171 1998 DH
2
La Madrina 299,700 1994 DH
3
La Prudencia 298,900 1993 DH CLEAN / PRODUCT TANKERS Dwt Built Hull Ice Class
AFRAMAX - LR
1
Proteas 117,055 2006 DH 1A
2
Promitheas 117,055 2006 DH 1A
3
Propontis 117,055 2006 DH 1A ,
SUEZMAX
1
DP2 Shuttle 157,000 2013 DH
2
DP2 Shuttle 157,000 2012 DH
3
Spyros K 158,000 2011 DH
4
Dimitris P 158,000 2011 DH
5
Arctic 163,216 2007 DH 1A A t ti 163 216 2007 DH 1A
PANAMAX
1
World Harmony 74,200 2009 DH
2
Chantal 74,329 2009 DH
3
Selini 74,296 2009 DH
4
Salamina 74,251 2009 DH
5
Selecao 74,296 2008 DH
6
Socrates 74 327 2008 DH
6
Antarctic 163,216 2007 DH 1A
7
Archangel 163,216 2006 DH 1A
8
Alaska 163,250 2006 DH 1A
9
Eurochampion 2004 164,608 2005 DH 1C
10 Euronike
164,565 2005 DH 1C
11 Triathlon
164,445 2002 DH S
6
Socrates 74,327 2008 DH
7
Maya (1) 68,439 2003 DH
8
Inca (1) 68,439 2003 DH
9
Andes 68,439 2003 DH
HANDYMAX - MR
1
Ariadne 53,021 2005 DH 1A
12 Silia T
164,286 2002 DH
AFRAMAX
1
Uraga Princess 105,344 2010 DH
2
Sapporo Princess 105,354 2010 DH
3
Asahi Princess 105,372 2009 DH
4
Ise Princess 105,361 2009 DH
5
M i P i 105 346 2008 DH ,
2
Artemis 53,039 2005 DH 1A
3
Afrodite 53,082 2005 DH 1A
4
Apollon 53,149 2005 DH 1A
5
Aris 53,107 2005 DH 1A
6
Ajax 53,095 2005 DH 1A
HANDYSIZE - MR
5
Maria Princess 105,346 2008 DH
6
Nippon Princess 105,392 2008 DH
7
Izumo Princess 105,374 2007 DH
8
Sakura Princess 105,365 2007 DH
1
Andromeda 37,061 2007 DH 1A
2
Aegeas 37,061 2007 DH 1A
3
Byzantion 37,275 2007 DH 1B
4
Bosporos 37,275 2007 DH 1B
5
Amphitrite 37,061 2006 DH 1A
6
Arion 37,061 2006 DH 1A
7
Didimon 37,432 2005 DH
(1) 51% ownership
15
,
8
Delphi 37,432 2004 DH
LNG
1
Neo Energy 85,602 2007 DH
Blue-Chip Clientele – Repeat Business
1. Petrobras 15.5%
TOP CLIENTS (2010) - IN TERMS OF REVENUES
2. BP Shipping 8.9% 3. Exxon 8.6% 4. Flopec 8.5% 5. HMM 7.8% 6 St 4 5% 6. Stena 4.5% 7. Vitol 4.3% 8. Dorado 3.2% 9. Neste Oil 2.8% 16
Earnings Visibility (as of Nov.30, 2011 – variable rates subject to market)
Socrates (PNX) Selecao (PNX) Archangel (SZX) Artemis (HMX) Silia T (SZX) Neo Energy (LNG) DP2 (Shuttle) DP2 (Shuttle)
UNDER CONSTRUCTION
TIME CHARTER
Euronike (SZX) Spyros K (SZX) Dimitris P (SZX) Didimon (HSZ) Nippon Princess (AFR) Maria Princess (AFR) Millennium (VLCC) Aegeas (HSZ) Delphi (HSZ) Alaska (SZX)
mployment
A ti (SZX) Maya (PNX) Antarctic (SZX) Ariadne (HMX) Eurochampion 2004 (SZX) World Harmony (PNX) Inca (PNX) Chantal (PNX) Andes (PNX) Triathlon (SZX) Euronike (SZX)
TIME CHARTER W/PROFIT SHARE
Secured Em
La Prudencia (VLCC) Salamina (PNX) Selini (PNX) Ajax (HMX) Aris (HMX) Amphitrite (HSZ) Arion (HSZ) Apollon (HMX) Afrodite (HMX) Arctic (SZX)
POOL
Variable rates
Sakura Princess (AFR) Sapporo Princess (AFR) Izumo Princess (AFR) Asahi Princess (AFR) Uraga Princess (AFR) Propontis (AFR) Promitheas (AFR) Proteas (AFR) Ise Princess (AFR) La Madrina (VLCC)
SPOT
N
e m b e r
1 D e c e m b e r
1 J a n u a r y
2 F e b r u a r y
2 M a r c h
2 A p r i l
2 M a y
2 J u n e
2 J u l y
2 A u g u s t
2 S e p t e m b e r
2 O c t
e r
2 N
e m b e r
2 D e c e m b e r
2 J a n u a r y
3 M a r c h
3 A p r i l
3 M a y
3 J u n e
3 J u l y
3 A u g u s t
3 A u g u s t
3 O c t
e r
3 O c t
e r
3 D e c e m b e r
3
Andromeda (HSZ) Byzantion (HSZ) Bosporos (HSZ) Sakura Princess (AFR)
17
Secured Revenues (TC, TC w/PS, Pool)
2012 2013 (1) Based on employable dates and includes vessels time charter, pools – subject to change based on new deliveries and potential changes in TEN’s chartering policy
57% Fixed 44% Fixed Minimum Revenues (Expected) $170m Minimum Revenues (Expected) $163m As of Dec. 1, 2011 28 vessels with time charter employment only (profit-share vessels at min. rates) have secured:
$333m
789 months forward coverage - $560m in minimum gross revenues Total Operating Fleet Average Employment: 1.4 years
(1) Includes delivery and employment of two DP2 Shuttle tankers currently under construction. The first from 1/1/13 and the second from 4/1/13
18
Recent Chartering Activity 12 years 12 years 15 years (x 2) 15 years (x 2) 11 years 11 years 4 years 4 years 11 years 11 years 4 years 4 years
Above charters are expected to generate over $800 million in total gross revenues over respective employments….
19
Superior Chartering & Operational Performance
Modern homogeneous fleet and sister-vessel concept combined with economies of scale achieved by the joint venture between Tsakos Shipping and Columbia ShipManagement has enabled TEN to outperform the peer group in terms of vessel operations ICAP Daily TCE (1) TEN (1) VLCC $12,339 $19,238 (+55%) Suezmax $10,037 $23,727 (+136%) Aframax $7,551 $13,451 (+78%) Panamax $3,304 $15,351 (+379%) MR $11,324 $12,477 (+10%)
(1) ICAP Shipping, TEN 2011 YTD average as of Sep. 30, 2011
20
S&P Activity - Integral Part of Operations
Sale & Purchase activity integral to operations – Close to 100 transactions - realizing actual value Si 2003 TEN h t d it l i f it l & Since 2003 TEN has generated capital gains from its sale & purchase activity close to $280 million $29 million average per year in capital gains since NYSE listing in 2002 Unprecedented fleet growth Maintain fleet modernity Sale & Purchase activity integral to operations On average approximately 27% of net income in capital gains
21
Strategic Growth in Challenging Times
T i th E it k t ith i i i th
$85m
$100 000
$125m
Tapping the Equity markets…with view in growing the company
World Crisis
4 Vessels 12 Vessels 26 Vessels 40 Vessels 50 Vessels
$80,000 $90,000 $100,000
$35m $95m 9/11 Iraq War $20m
50 + Vessels
$50,000 $60,000 $70,000
Asian Crisis Gulf War rate (VLCC) $85m
$20,000 $30,000 $40,000
1 year T/C
$0 $10,000 9 2
9 2
9 3
9 4
9 5
9 5
9 6
9 7
9 8
9 8
9 9
1
1
2
3
4
4
5
6
7
7
8
9
1
1
1 9 9 2 1 9 9 2 1 9 9 3 1 9 9 4 1 9 9 5 1 9 9 5 1 9 9 6 1 9 9 7 1 9 9 8 1 9 9 8 1 9 9 9 2 2 1 2 1 2 2 2 3 2 4 2 4 2 5 2 6 2 7 2 7 2 8 2 9 2 1 2 1
Taking advantage of tanker lows…. 22
23
Strong Profitability
In US$ million except per share and vessel data. Numbers reflect 2:1 Stock Split effected on November 15, 2007
2010 2011 9mo 2009 2008 2007 2006 2005 2004
Expressed in million US dollars
2010 2011 9mo 2009 2008 2007 2006 2005 2004
Expressed in million US dollars
$322 $408 46.1 $202 $294 47.7 $368 $445 46.6 $540 $623 44.1 $429 $501 41.7 $359 $260 $276 TCE Revenues, net (1) $428 $296 $318 Total Revenues 33.8 26.1 27.3
$322 $408 46.1 $202 $294 47.7 $368 $445 46.6 $540 $623 44.1 $429 $501 41.7 $359 $260 $276 TCE Revenues, net (1) $428 $296 $318 Total Revenues 33.8 26.1 27.3
$19.7 $19.8 $5.0 $(32.9) $5.1 $28.7 $35 $202.9 $69 $183.2 $63 $45 $21 Capital Gains $196.4 $161.8 $143.3 Net Income $19.7 $19.8 $5.0 $(32.9) $5.1 $28.7 $35 $202.9 $69 $183.2 $63 $45 $21 Capital Gains $196.4 $161.8 $143.3 Net Income 2.2% 39.6 $0.50 n/a 46.1 $(0.71) 3.2% 37.2 $0.77 38.0 38.2 38.1 39.6 38.2 W/Av. Shares Out. diluted 23.7% $5.33 24.8% $4.79 32.3% 31.1% 45.5% ROE $5.15 $4.09 $3.76 EPS, diluted (split adjusted) 2.2% 39.6 $0.50 n/a 46.1 $(0.71) 3.2% 37.2 $0.77 38.0 38.2 38.1 39.6 38.2 W/Av. Shares Out. diluted 23.7% $5.33 24.8% $4.79 32.3% 31.1% 45.5% ROE $5.15 $4.09 $3.76 EPS, diluted (split adjusted)
(1) TCE = Revenues less voyage expenses (bunkers, port expenses, canal dues) (2) EBITDA
Net Income + Interest and Finance Cost + Depreciation + Amortization
$179 $79 $176 $377 $345 $303 $215 $198 EBITDA (2) $179 $79 $176 $377 $345 $303 $215 $198 EBITDA (2)
24
(2) EBITDA = Net Income + Interest and Finance Cost + Depreciation + Amortization
Strong Balance Sheet
$277 2010 $231 2011 9mo $296 2009 $312 2008 $181 2007 2006 2005
Expressed in million US dollars
$175 $146 Cash & Cash equivalents $277 2010 $231 2011 9mo $296 2009 $312 2008 $181 2007 2006 2005
Expressed in million US dollars
$175 $146 Cash & Cash equivalents $2 235 $82 $367 $2 302 $19 $304 $2 009 $49 $472 $2 155 $54 $371 $1 900 $170 $276 $1 458 $711 V l ’ t b k l $261 $150 Advances for vessels under construction $223 $192 Total Current Assets (incl. cash) $2 235 $82 $367 $2 302 $19 $304 $2 009 $49 $472 $2 155 $54 $371 $1 900 $170 $276 $1 458 $711 V l ’ t b k l $261 $150 Advances for vessels under construction $223 $192 Total Current Assets (incl. cash) $134 $2,702 $2,235 $123 $2,643 $2,302 $173 $2,550 $2,009 $92 $2,602 $2,155 $44 $2,363 $1,900 $23 $51 Current portion of long term debt $1,970 $1,090 Total Assets $1,458 $711 Vessels’ net book value $134 $2,702 $2,235 $123 $2,643 $2,302 $173 $2,550 $2,009 $92 $2,602 $2,155 $44 $2,363 $1,900 $23 $51 Current portion of long term debt $1,970 $1,090 Total Assets $1,458 $711 Vessels’ net book value $1,013 $1,429 $223 $976 $1,424 $218 $914 $1,330 $264 $915 $1,423 $190 $858 $1,346 $132 $755 $607 Total Stockholders’ equity $1,111 $382 Long term debt, net of current portion $101 $92 Total Current Liabilities $1,013 $1,429 $223 $976 $1,424 $218 $914 $1,330 $264 $915 $1,423 $190 $858 $1,346 $132 $755 $607 Total Stockholders’ equity $1,111 $382 Long term debt, net of current portion $101 $92 Total Current Liabilities 56% $1,562 57% $1,548 57% $1,503 57% $1,514 59% $1,390 $1,134 $434 Total Debt 56% 32% Net Debt/Cap 56% $1,562 57% $1,548 57% $1,503 57% $1,514 59% $1,390 $1,134 $434 Total Debt 56% 32% Net Debt/Cap
25
Market Outperform
Total returns to investors who subscribed to the IPO in March 2002 and reinvested their dividends have been +3.0% p.a.
at 2.9%
26
Attractive stock valuation Attractive stock valuation – – Stock close to 52 Stock close to 52-
wk lows
Modern & diversified tanker fleet Modern & diversified tanker fleet
No Greek country risk No Greek country risk No Greek country risk No Greek country risk
Earnings visibility Earnings visibility
Strong balance sheet Strong balance sheet
Strong balance sheet Strong balance sheet
Easy to analyze Easy to analyze
T k d T k d P fit bl th h t k t l P fit bl th h t k t l
Track record Track record -
Profitable throughout market cycles
Growth potential Growth potential
Dividend payments Dividend payments
Public markets experience Public markets experience
27
Ice Ice-
class capabilities
Management largest shareholder Management largest shareholder
Company Contact: Paul Durham, Chief Financial Officer pdurham@tenn.gr
28
Tsakos Energy Navigation, Ltd Tsakos Energy Navigation, Ltd – – 367 Syngrou Av. , Athens 175 64, Greece Tel: +30210 940 7710, Fax: +30210 940 7716 367 Syngrou Av. , Athens 175 64, Greece Tel: +30210 940 7710, Fax: +30210 940 7716 email: ten@tenn.gr email: ten@tenn.gr George Saroglou, Chief Operating Officer gsaroglou@tenn.gr Harrys Kosmatos, Corporate Development Officer hkosmatos@tenn.gr
Demand – Positive Long-Term Outlook Demand (today) – Positive Long-Term Outlook
Tremendous potential of China and India with a combined population of 2.5 billion in a world of 6.5 billion. Their per capita oil consumption is at extremely low levels and have already embarked on an aggressive industrialization program If China reaches the same levels of consumption per capita BARRELS OF OIL PER CAPITA PER ANNUM
(Source: BP Statistical Review of World Energy June 2010)
22
20 25
If China reaches the same levels of consumption per capita as Thailand, Chinese oil demand (based on existing population) would rise to 18 mbpd, an increase of 10 mbpd from current levels IEA expects demand for oil to continue its recovery in 2012
12 11 5 2 1
5 10 15 20
IEA expects demand for oil to continue its recovery in 2012 due to improved financial conditions worldwide => 90.5 mbpd, +1.3 mbpd over 2011 or 1.5% increase OPEC cut compliance (50%) and limited non-OPEC supply growth (for 2010) should tighten OECD stocks by
2010
United States Japan EU Thailand China (incl. HK) India
GLOBAL OIL DEMAND Year Demand YoY Change % Change 2006 85.3 mbpd +1.1 mbpd +1.3% 2007 87 0 mbpd +1 7 mbpd +2 0%
supply growth (for 2010) should tighten OECD stocks by the end of 1H 2011 World economies rebounding Crude oil storage due to oil contango although narrow at present
2007 87.0 mbpd +1.7 mbpd +2.0% 2008 86.4 mbpd
2009 85.1 mbpd
2010 88.3mbpd +9.7 mbpd +3.1%
Crude oil storage due to oil contango although narrow at present (in VLCCs, Suezmaxes and Aframaxes) could be a swing factor IMF revised world GDP growth in 2011 and 2012 at 4.0% in each year
29
2011 89.2 mbpd +0.2 mbpd +1.0% 2012 (est) 90.5 mbpd +1.3 mbpd +1.5%
Source: International Energy Agency, Oil Market Report, Nov. 2011
Record Number of VLCC Fixtures
,
30
Newbuilding Orderbook on a Downward Trend
700
At end of 2010 the fleet Orderbook stood at 22% of the fleet At November 2011 it stood at 15%
600 700 400 500
mber of Ships
200 300
Num
100 Handy Panamax Aframax Suezmax VLCC
2008 2009 2010 2011 (Nov)
Source: Clarkson Research Studies, Oil & Tanker Trades Outlook - November 2011
31
Newbuilding Orderbook (Delivery Schedule)
450 500 550
Slippage – Deferrals - Cancellations?
250 300 350 400 450 r of Ships
48% of Orderbook
50 100 150 200 Number
18.5% of Orderbook 29% of Orderbook 5% of Orderbook VLCC 22 63 46 11 Suezmax 7 68 41 6 Aframax 21 55 16 7 2011 (Nov) 2012 2013 2014 142 122 99 Total NBs 15 10 26 Total S/Hs
Handysize Panamax Aframax Suezmax VLCC
Panamax 14 19 22 Handysize 54 103 58 6 55 221 639 15 112 178
y 32
Source: Clarkson Research Studies, Oil & Tanker Trades Outlook - November 2011
Newbuilding Orderbook (Delivery Schedule) cont.
FLEET ORDERBOOK (No. of Vessels) AS OF Nov 1, 2011 No. Nov 01 - Dec 31 2012 2013 2014 Total Pct of Fleet No. 31 2012 2013 2014 Total Fleet Tankers VLCC 569 22 63 46 11 142 25,0% Suezmax 442 7 68 41 6 122 27,6% Aframax 906 21 55 16 7 99 10,9% Panamax 410 14 19 22 55 13,4% MRs (>30K dwt) 1 836 54 103 58 6 221 12 0% MRs (>30K dwt) 1.836 54 103 58 6 221 12,0% 4.163 118 308 183 30 639 15,3% Bulk Carriers Capesize 100k - 120k dwt 60 23 35 14 9 81 135,0% 120k - 160k dwt 173 3 3 1,7% 160k d 1 063 111 218 90 15 434 40 8% 160k and over 1.063 111 218 90 15 434 40,8% Total Capes 1.296 134 256 104 24 518 40,0% Panamax 1.958 178 437 186 42 843 43,1% Handymax 2.389 200 369 156 20 745 31,2% Handysize 3.035 261 307 86 12 666 21,9% 8.678 773 1.369 532 98 3.290 37,9% Containers 8,000+ teu Post Px 377 18 85 101 73 277 73,5% 3 - 8K teu Post Px 532 14 67 72 4 157 29,5% 3 - 7,999 teu Px 961 19 28 13 60 6,2% 2-2,999 teu 715 7 8 17 32 4,5% 1-1,999 teu 1.281 26 40 32 6 104 8,1% , , 100 - 999 teu 1.217 27 4 2 33 2,7% 5.083 111 232 237 83 663 13,0% LNG 100,000+ m3 330 3 4 22 27 56 17,0%
33
Historical Healthy Operating Environment
Structural changes and improved ship designs have led to higher base rates over the last three decades Flight to quality has raised the floor for double hull tankers
$47,250
$50,000
TEN’s modern double-hull fleet on the forefront of reaping the rewards
$25 473 $35,500 $26,670
$30,000 $40,000
$12,714 $25,473 $9,388 $17,890 $15,873 $10,134
$20,000 $0 $10,000
1980-89 1990-99 2000-2009
34
VLCC Suezmax Aframax
Source: Clarkson Research Studies
Decathlon / Pentathlon Case Study
$48.0m (2002) Sold: $55.0m (2003) GERMAN K/G GERMAN K/G Repurchased: $47.5m (2008) TC Back p $ ( ) Net profit: $24 m Sold: $51.5m (2009/10)
35
Market
XYZ SHIPPING CO. XYZ SHIPPING CO.
This presentation may contain forward-looking statements that are not based on historical fact, including without limitation, statements containing the words “expects,” “anticipates,” “intends,” “plans,” “believes,” “seeks,” “estimates” and similar expressions. Because these forward-looking statements involve known and unknown risks and uncertainties, there are important factors that could cause actual results, events or developments to differ materially from those expressed or implied by these forward-looking statements Such factors include those risks materially from those expressed or implied by these forward-looking statements. Such factors include those risks described from time to time in Tsakos Energy Navigation Ltd’s (TEN) filings with the Securities and Exchange Commission, including, without limitation, the risks described in TEN’s most recent Annual Report on Form 20-F on file with the Securities and Exchange Commission. These factors should be considered carefully and you are cautioned not to place undue reliance on such forward-looking statements. All information is current as of the date