SLIDE 1
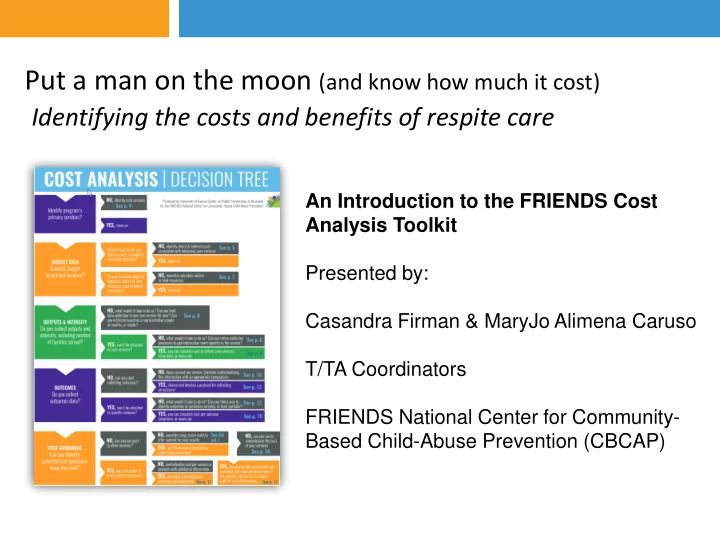
Put a man on the moon (and know how much it cost)
Identifying the costs and benefits of respite care
An Introduction to the FRIENDS Cost Analysis Toolkit Presented by: Casandra Firman & MaryJo Alimena Caruso T/TA Coordinators FRIENDS National Center for Community- Based Child-Abuse Prevention (CBCAP)
SLIDE 2
Goals
Introduction to cost analysis Orientation to new FRIENDS cost analysis resources Demonstration & Application of the materials
SLIDE 3 What is cost analysis?
Cost analysis is used to accurately identify the full cost of providing a service
More sophisticated analyses estimate:
- cost avoidance
- return on investment
Simplest forms provide an accurate estimate of the cost of delivering services, incorporating:
- direct costs
- indirect costs
- a measure of the reach of service (e.g. numbers of families served)
SLIDE 4
Why do it?
Requirements Balance awareness of revenues with costs Cost as a metric everyone understands Way to talk about value, particularly in the context of scarcity Take part in a conversation that is already taking place
SLIDE 5 Scope of the Resources from FRIENDS
Materials on cost analysis for prevention programs such as respite that will help them:
- Collect appropriate data
- Produce accurate estimates for cost of delivering services
- Estimate cost avoidance and/or return on investment
Series of briefs, guides, and template
SLIDE 6
The Materials
The Practitioner’s Guide to Cost Analysis: First Steps Section on Social Math Missouri Case Study The Practitioner’s Guide to Cost Analysis Part 2: Conducting Your First Cost Analysis Readiness Assessment Decision Tree Costing template in excel and calculating pdf formats
SLIDE 7 Where to find them
https://friendsnrc.org/activities-that-support-collaboration/cost-analysis
SLIDE 8
THE PRACTITIONER’S GUIDE TO COST ANALYSIS
FIRST STEPS
SLIDE 9 Creating stakeholder buy-in
– Discuss the process with service providers and other stakeholders ahead of time, and incorporate their feedback – Encourage providers to think of time spent on CA as crucial to your program’s ability to continue, grow, and thrive – Provide talking points for explaining the importance of data collection to families – Identify how program data will be analyzed and reported – Protect client confidentiality and establish clear parameters for data access
SLIDE 10 Data collection and processing
–Use existing data sources where possible to eliminate redundancy in collection –Identify collection tools that ensure data quality and comprehensiveness –Ensure all costs (direct and indirect) are accurately and fully representative –Identify outcomes you currently or would like to measure, and consider how they could be attached to cost –Don’t lose sight of less tangible outcomes
SLIDE 11 Communication and using results
–Involve families in the process –Place results in the proper context –Use appropriate language for your audience –Try using social math as a way to communicate numbers meaningfully –Look for savings to the community, state, or society at large –Examine data on program impact and effectiveness –Use clear evidence of programmatic value to pursue new sources of funding and evaluate future allocations
SLIDE 12
THE PRACTITIONER’S GUIDE TO COST ANALYSIS
PART 2: CONDUCTING YOUR FIRST COST ANALYSIS
SLIDE 13 PART 2 Overview
- A practical guide to making analytical
choices and calculating figures
– Direct, indirect, and in-kind costs – Calculating cost to deliver services – Calculating cost per outcome – Calculating cost avoidance – Readiness assessment decision tree
SLIDE 14 Direct, indirect, in-Kind costs
Distinctions between direct costs, indirect costs, and in- kind resources with examples
Detailed discussions of when and how to include each in a cost analysis, including:
- How to assign indirect costs across
multiple services
- When you would want to include in-
kind resources, and how to do it
SLIDE 15
Calculating cost to deliver service
Discussion of outputs and intensity Incorporating variation in time spent serving families due to differing needs and attrition
SLIDE 16 Calculating cost per outcome
Distinguishing between
Choosing an
Calculating cost avoidance and return on investment
SLIDE 17 Cost Analysis Rules
- Denominators must match: any calculations incorporating
multiple pieces of data must share a common metric (such as costs and families served per year)
- When you have to make an assumption (and you will), you
just have to make sure it’s logical, appropriate to the nature
- f your service, and easily explained.
- When in doubt, choose the conservative option. It is always
better to overestimate the cost of your service and underestimate cost avoidance.
- Document, document, document! Keep notes on the sources
- f all data you use, all calculations you perform, and all
decisions you made and the reasoning behind them.
SLIDE 18 Breaks down multiple pieces that need to be in place to estimate and contextualize cost Creates linear decision-making path:
currently have available to you?
- What should be your next steps?
- What do you want to know more
about? Can use to navigate the guide
Readiness Assessment decision tree
SLIDE 19
COSTING TEMPLATES
SLIDE 20 Costing Templates
Calculates cost per family served to deliver a service Incorporates direct and indirect costs and in-kind resources Second sheet calculates families served proportionally depending on dosage Available in Excel and PDF
SLIDE 21 Final thoughts
- Your estimates are as good as your data. Most cost
analyses involve thoughtfully incorporating multiple sources of data. The more complete your data are, the better your estimates will be.
- Don’t let the numbers speak for themselves.
Contextualize and communicate the meaning of your results -- your audience probably doesn’t know what is “good,” reasonable, or typical.
- Costs are investments. Find a way to convey what
we (the funder, the community, etc.) are getting for investing in your program.
SLIDE 22
Contact Us with questions!
Casandra Firman FRIENDS National Center for CBCAP Cfirman@friendsnrc.org MaryJo Alimena Caruso FRIENDS National Center for CBCAP mjcaruso@friendsnrc.org