
SLIDE 1
Global hotspots: how the evolving nutrition and agricultural landscape is changing the story of development for 2030
By: Tatyana El-Kour, MS, RDN, FAND
Global hotspots : how the evolving nutrition and agricultural - - PowerPoint PPT Presentation
Global hotspots : how the evolving nutrition and agricultural landscape is changing the story of development for 2030 By: Tatyana El-Kour, MS, RDN, FAND I currently work as a Nutrition Coordinator for Action Against Disclaimer Hunger
Global hotspots: how the evolving nutrition and agricultural landscape is changing the story of development for 2030
By: Tatyana El-Kour, MS, RDN, FAND
Tatyana El-Kour, MS, RDN, FAND
Hunger - Lebanon
Nutrition Practice Group of the Academy of Nutrition and Dietetics.
for public, private, or commercial use without prior approval.
Identify and prioritize hunger, malnutrition, and nutrition security hotspots where food and nutrition policy and agricultural development meet to inspire social action on realizing the Sustainable Development Goals. Describe trends, drivers, and challenges of the global agricultural landscape in the emerging development context. Discuss the impact of evidence-informed worldview on changing population behavior towards food, nutrition and agricultural policy choices and actions within everyday practice.
Almost doubled Remained more
Almost halved
Over the last 200 years, poverty rate fell continuously coupled with 7-fold increase in world population
Every day 250,000 people graduate from extreme poverty + 300,000 get electricity for the first time + 250,000 get access to clean water (worldbank.org)
Mapping progress towards eradicating world hunger
Global Hunger Index, 2016
Mapping progress towards eradicating world hunger
Per map, the higher the score, the larger the circle size. The African region has the greatest number and size of circles indicating highest hunger scores.
Under-5 Mortality Rate
The African region has the highest number of labels and possesses the greatest under-5 mortality rates
The developing country regions have not all made equal progress
60 80 100 120 140 160 180 200 70 75 80 85 90 95 00 Asia and the Pacific Near East and North Africa Sub-Saharan Africa Latin America and the Caribbean 04
1700 1750 1800 1850 1900 1950 2000 2050 90/91 92/93 94/95 96/97 98/99 00/01 02/03 04/05 Production Utilization Million tonnes 05/06*
Food shortages in the Greater Horn of Africa, including South Sudan, Somalia, and Yemen
Billion US$ 2 4 6 8 10 12 14 61 65 69 73 77 81 85 89 93 97 01 03 total agricultural exports total agricultural imports
Link between agricultural and rural development and food security
Countries with worsening levels of undernourishment have seen a declining agricultural GDP
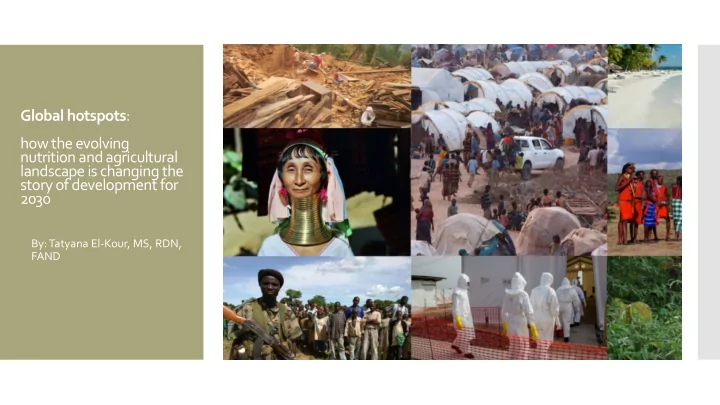
Typhoon Haiyan – Philippines 2013 Sahel Food insecurity 2011-present Syrian Refugees in Amman, Jordan, 2011- present Conflict IDP and food security crisis South Sudan 2013- present Ebola epidemic Sierra Leone, Liberia, Guinea 2013-2015
Mapping hunger, malnutrition, nutrition security hotspots using geographic information systems Linking agricultural development to improving food and nutrition security Trends, drivers, and challenges of agricultural development, including: global population, income, food consumption patterns, food supply chain, prices of agricultural commodities, food shortages and food emergencies Implications of agricultural development on meeting the Zero Hunger Challenge with emphasis on contribution to cross-cutting issues and multi-sectoral action Application of evidence-informed facts in the context of population behavior change
The world is evolving and professionals/educators’ perceptions need to evolve with it. There is dire need to know the facts of the past in the context of shaping the story of the future for realizing the Sustainable Development Goals. Knowledge alone is not enough. There are new skills, features and behaviors to possess for driving population engagement through data and emerging media.