
SLIDE 1
Healthier Together
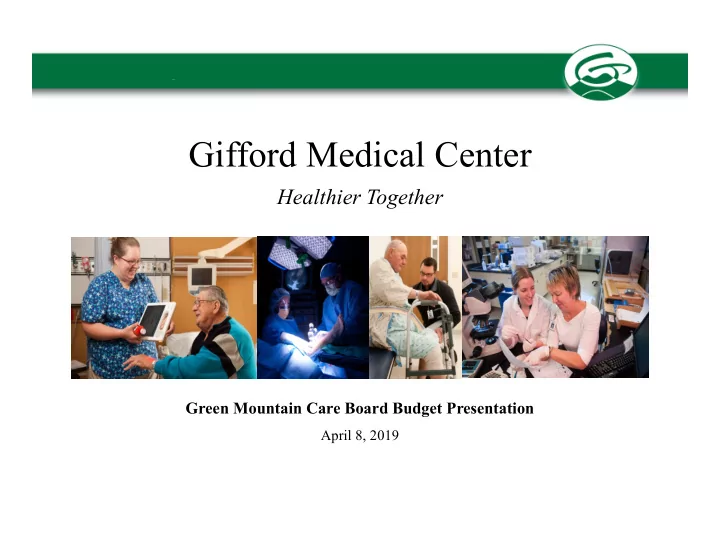
Gifford Medical Center
Green Mountain Care Board Budget Presentation
April 8, 2019
Gifford Medical Center Healthier Together Green Mountain Care Board - - PowerPoint PPT Presentation
Gifford Medical Center Healthier Together Green Mountain Care Board Budget Presentation April 8, 2019 Introduction Organization Chart Gifford Health Care (Community Health Center) Gifford Retirement Gifford Medical Center Community
Green Mountain Care Board Budget Presentation
April 8, 2019
(Community Health Center)
Gifford Retirement Community
(Senior Services)
Gifford Medical Center
(Critical Access Hospital)
Starting on 07/01/2014 Gifford Health Care (primary care) started operations, on 05/22/2015 Gifford Retirement Community (nursing home) opened their doors. Prior to these dates, GHC and GRC were considered departments
by ~ $10 million.
5-Year Results
NPR/FPP Actuals Actuals Actuals Actuals Actuals 4-Year Budget FY2014 FY2015 FY2016 FY2017 FY2018 CAGR FY2019 58,282,092 $ 53,896,728 $ 54,787,886 $ 54,307,372 $ 48,884,171 $
55,894,651 $ (% Change)
1.7%
Corporate Restructure NPR/FPP Actuals Actuals Actuals Actuals Actuals 4-Year Budget FY2014 FY2015 FY2016 FY2017 FY2018 CAGR FY2019 FQHC 2,553,117 $ Nursing Home 3,042,599 $ 1,052,558 $ Re-Stated 52,686,376 $ 52,844,170 $ 54,787,886 $ 54,307,372 $ 48,884,171 $
55,894,651 $ (% Change) 0.3% 3.7%
History: FY 2014 - GHC created on 07/01/14 FY 2015 - GRC created 05/26/15 FY 2017 - GHC Primary Care providers retire or depart, FTE's FY17 = 23.93 vs FY19 = 26.17 FY 2017 - GMC utilizes general surgery & orthopedics locums FY 2018 - GMC 12/17 Orthopedic Provider departs FY 2018 - GMC re-establishes orthopedics program FY 2019 - GMC 10/18 re-establishes general surgery program
Gifford experienced financial challenges in FY 2018, and ended the year with a $5.4 million loss on
and expected dips in volume during our electronic health record implementation. To improve our financial performance we focused on three areas – achieving our expected patient volumes, reducing costs, and expanding our community partnerships. We expect our volumes to increase as we build back our surgical services and fill needed primary care
productivity in the coming years from our clinics. We have asked all employees to identify areas where we can reduce our costs to accommodate the revenue shortfalls– and they have responded to our request. We believe that now that the EMR is up and running expenses will come into line without the required training and go-live pressures. Additionally, with our new surgeons that started in August 2018 we will no longer have to pay for expensive locums. Gifford has been able to accumulate financial reserves over the years to invest in facility and equipment needs, and to insulate us against difficult financial times. These reserves have allowed us to weather these challenges for the past two years – but we cannot rely on them indefinitely and need to return to achieving positive financial results.
Category Years Explanation REVENUE Patient Revenue Ac 18 - Bud 18 Inpatient - lower than expected surgical and inpatient volumes EXPENSES Wages - Non Providers Ac 18 - Bud 18 7% reduction due to use of low census, attrition, productivity expectations Benefits Ac 18 - Bud 18 In-line with 2018 actual expectations Advertising Ac 18 - Bud 18 Due to cost initiatives expense decreased by 68%: Rework paper reports to be electronic versions only Reduced print ads Held on new intranet site Depreciation Ac 18 - Bud 18 Moving to cloud based application which is decreasing expenses by 11% Other Ac 18 - Bud 18 Reductions due to cost initiatives: Dues - $41k Network printers/copies - $30k Freight - $20k Postage - $13k Above initiatives were offset by an increase of other direct costs - $91k Purchase Services Ac 18 - Bud 18 Utilized locum providers - $662k Moved orthopedist from employed to contracted service - $408k Utilized travelers/contract staff - $800k Moved to cloud based IT applications - $100k Utilities Ac 18 - Bud 18 Utilizing Efficiency Vermont Cost initiatives specific to utilization of heat/AC/lights etc. Outpatient - down do to lack of surgical and primary care providers as well as implementation of a new EMR Clinic - down due to lack of surgical providers as well as implementation of a new EMR
GIFFORD MEDICAL CENTER REPORT 1 SUMMARY STATEMENT OF REVENUE & EXPENSE 2018 Budget 2018 Feb YTD 2018 Actual 2019 Budget 2019 Feb YTD 2019 Projected REVENUES INPATIENT CARE REVENUE 32,061,329 $ 10,461,658 $ 24,635,137 $ 27,641,990 $ 9,473,440 $ 24,981,021 $ OUTPATIENT CARE REVENUE 77,347,991 $ 29,943,639 $ 69,112,117 $ 76,981,411 $ 29,078,324 $ 74,748,517 $ OUTPATIENT CARE REVENUE - PHYSICIAN 13,992,094 $ 5,174,908 $ 11,944,067 $ 14,615,644 $ 5,025,363 $ 12,918,159 $ SWING BEDS PT CARE REVENUE 1,806,392 $ 942,678 $ 1,947,193 $ 2,049,732 $ 655,801 $ 1,878,306 $ GROSS PATIENT CARE REVENUE 125,207,806 $ 46,522,883 $ 107,638,514 $ 121,288,777 $ 44,232,928 $ 114,526,002 $ DISPROPORTIONATE SHARE PAYMENTS 645,999 $ 269,166 $ 645,999 $ 554,798 $ 231,166 $ 554,798 $ BAD DEBT (3,316,988) $ (977,096) $ (2,317,389) $ (2,915,932) $ (725,066) $ (2,625,024) $ FREE CARE (558,851) $ (186,287) $ (522,609) $ (480,167) $ (167,406) $ (449,445) $ DEDUCTIONS FROM REVENUE (62,463,956) $ (24,352,792) $ (56,600,344) $ (62,552,825) $ (23,110,234) $ (59,493,343) $ NET PATIENT CARE REVENUE 59,514,010 $ 21,275,874 $ 48,844,171 $ 55,894,651 $ 20,461,388 $ 52,512,988 $ TOTAL NPR & FPP & RESERVES & OTHER 59,514,010 $ 21,275,874 $ 48,844,171 $ 55,894,651 $ 20,951,124 $ 52,512,988 $ OTHER OPERATING REVENUE 909,288 $ 422,229 $ 1,107,945 $ 866,476 $ 409,601 $ 1,160,131 $ TOTAL OPERATING REVENUE 60,423,298 $ 21,698,103 $ 49,952,116 $ 56,761,127 $ 21,360,725 $ 53,673,119 $ TOTAL OPERATING EXPENSE 59,053,344 $ 24,243,003 $ 55,321,562 $ 55,346,116 $ 21,407,588 $ 53,164,310 $ NET OPERATING INCOME (LOSS) 1,369,954 $ (2,544,900) $ (5,369,446) $ 1,415,011 $ (46,863) $ 508,809 $ NON-OPERATING REVENUE 850,000 $ 1,010,966 $ 2,155,792 $ 849,996 $ 903,344 $ 1,189,214 $ EXCESS (DEFICIT) OF REVENUE OVER EXPENSE 2,219,954 $ (1,533,934) $ (3,213,654) $ 2,265,007 $ 856,481 $ 1,698,023 $
5-Year Results
NPR/FPP Actuals Actuals Actuals Actuals Actuals 4-Year Budget FY2014 FY2015 FY2016 FY2017 FY2018 CAGR FY2019 58,282,092 $ 53,896,728 $ 54,787,886 $ 54,307,372 $ 48,884,171 $
55,894,651 $ (% Change)
1.7%
Corporate Restructure NPR/FPP Actuals Actuals Actuals Actuals Actuals 4-Year Budget FY2014 FY2015 FY2016 FY2017 FY2018 CAGR FY2019 FQHC 2,553,117 $ Nursing Home 3,042,599 $ 1,052,558 $ Re-Stated 52,686,376 $ 52,844,170 $ 54,787,886 $ 54,307,372 $ 48,884,171 $
55,894,651 $ (% Change) 0.3% 3.7%
History: FY 2014 - GHC created on 07/01/14 FY 2015 - GRC created 05/26/15 FY 2017 - GHC Primary Care providers retire or depart, FTE's FY17 = 23.93 vs FY19 = 26.17 FY 2017 - GMC utilizes general surgery & orthopedics locums FY 2018 - GMC 12/17 Orthopedic Provider departs FY 2018 - GMC re-establishes orthopedics program FY 2019 - GMC 10/18 re-establishes general surgery program
Budget Goal
FY 19 Financial Cost Savings
Status Project Rev Exp Cash Flow Amount Notes In Process Lab Draws in outlying clinics X MA program will bring this service to Berlin and Bethel In Process Collect Co-Pay at Registration X Considering a pre-reg process for seamless registration Upgrading computers to have built in credit card readers Remove credit card machines and use on-line payment options Complete Increase use of payroll e-Statements X 6,000 $ Implemented on Jan. 31, 2019 In Process Trash vs. Recycling vs. Bio-Hazard X Reeducation on what belongs in what bin 83,000 pounds of compost diverted from trash Enhancing relationship with Parters for Health X In Process Utilize Thrift Shop for office supplies 1,200 $ Averaging $100 savings per month On Going Develop low census criteria X 6.8 FTE's Daily reports from finance (clinic visits, census) Prompt response to census On Going Implement staff cross training organization wide X Successful with current staff
FY 19 Financial Cost Savings
Status Project Rev Exp Cash Flow Amount Notes On Going Patient Care Coordination X Outreach to patients that are past due (2 years) for annual exam In Process One time discount on payment plans X X 140,222 $ Currently 183 patients Cash flow enhancement In Process MedHost weekly accounting (Emergency Room) X Are supplies being charged In Process Restructure ETO for salaried employees X In Process Manage lighting in public areas X Actively working on Efficiency VT program In Process Utlize evening / night staff for projects X In Process Evaluate mechanical system for chilled process savings X $13,000 in annual savings can be recognized In Process Contract Review X X X In Process Annual review of contracts to find cost savings Completed Contract Review X 227,000 $ In Process FTE/Salaries X 283,570 $