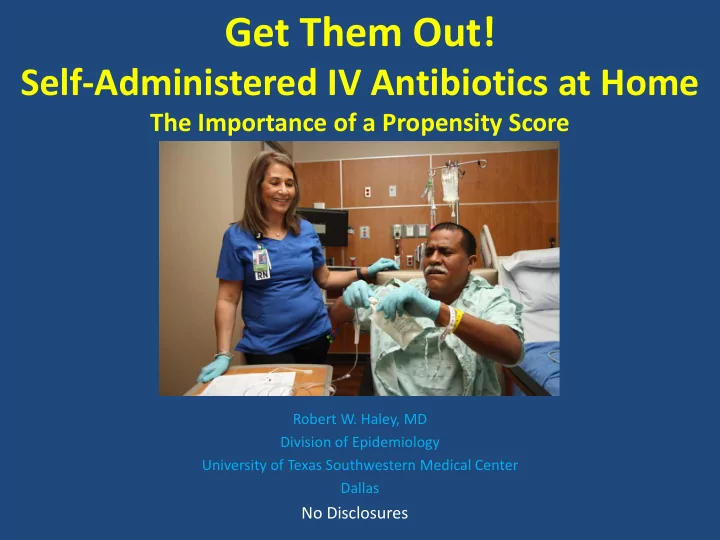
SLIDE 1 Get Them Out!
Self-Administered IV Antibiotics at Home
The Importance of a Propensity Score
Robert W. Haley, MD Division of Epidemiology University of Texas Southwestern Medical Center Dallas
No Disclosures
SLIDE 2 The Problem
- Every hospital has patients who require long-
term IV antimicrobial infusion.
– Staph septicemia – Bacterial endocarditis – Diabetic foot – Osteomyelitis
- After the initial workup, the patients occupy a
hospital bed only to receive the infusion.
- Insured or charity patients can be discharged
to receive infusions in an LTAC or home health nurse, but uninsured patients stay in hospital.
SLIDE 3 Hospital days
42 3
Intensity
Disadvantages of Long-term Antimicrobial Infusion in Hospital
Burden on safety-net hospitals Burden on patients
Risk of complications (e.g., infection)
SLIDE 4 Definition of OPAT
- Outpatient Parenteral Antimicrobial Therapy
- Provision of IV antibiotic therapy in at least 2
doses on different days outside the hospital.
– Allow patients to complete treatment safely and effectively in the comfort of their home or another
– Avoid the inconveniences, complications, and expense of hospitalization
SLIDE 5 Models of outpatient parenteral antimicrobial therapy (OPAT) delivery
Paladino J A , and Poretz D. CID 2010;51:S198-S208
SLIDE 6 Definition of OPAT
- Outpatient Parenteral Antimicrobial Therapy
- Provision of IV antibiotic therapy in at least 2
doses on different days outside the hospital.
– Allow patients to complete treatment safely and effectively in the comfort of their home or another
– Avoid the inconveniences, complications, and expense
- f hospitalization
- But not available to patients without funding (e.g.,
private insurance, Medicare, Medicaid or other local funding option).
SLIDE 7
Kavita Bhavan, MD
SLIDE 8
“Let unfunded patients do it themselves”
S-OPAT
Self-Administered Outpatient Parenteral Antimicrobial Therapy
SLIDE 9
S-OPAT Program
SLIDE 10 Intervention
- Developed program in 2009 as an alternative for
uninsured patients to complete long-term antibiotic therapy at home comparable to services received in traditional funded settings.
- Patients undergo bedside teaching and competency
assessment prior to discharge from hospital.
- Transitioned from the hospital into a dedicated post-
discharge OPAT clinic, and followed weekly by nurses for PICC line care and at fixed intervals by physicians to assess clinical response to therapy.
SLIDE 11 Best Practice Methods
- Dedicated multidisciplinary OPAT team: Physician,
Pharm D, Care Management, RN
- Effective multilingual patient education material at
the appropriate level of health literacy and employ the “teach back method” for bedside teaching
- Standardized core competency tool to test and
record patient’s ability to self-administer IV antibiotics
11
SLIDE 12
Incorporating Patient Safety into Transition of Care
SLIDE 13
SLIDE 14 Coaching patients for successful outcomes
SLIDE 15
Patient Education
SLIDE 16 Best Practice Methods
Schillinger D, Piette J, Grumbach K, Wang F, Wilson C, Daher C, Leong-Grotz K, Castro C, Bindman A. Closing the Loop Physician Communication With Diabetic Patients Who Have Low Health Literacy. Arch Intern Med/Vol 163, Jan 13, 2003
Teach-Back: Closing the Loop
SLIDE 17
Testing for Competency
SLIDE 18
Teaching Tools
SLIDE 19
Specific Instructions
SLIDE 20
Preparing Antibiotics
SLIDE 21
Wire coat hanger
Infusion by Gravity
SLIDE 22
Weekly Followup in S-OPAT Clinic
SLIDE 23 Study to Evaluate S-OPAT Objective
Determine whether indigent, often poorly educated and mostly non-English-speaking patients can self-administer long-term IV antibiotics at home (S-OPAT) as safely and effectively as traditionally accepted models of
- utpatient care by a healthcare practitioner
available to patients with funding (H-OPAT)
SLIDE 24 Outcomes
- Compared patients treated in S-OPAT with those
treated in H-OPAT on 2 outcomes
– 30-day readmission rate – 1-year mortality rate
- Calculated total number of hospital bed days
avoided, as reflected by number of days a patient self-administered parenteral antibiotic therapy as an outpatient under the S-OPAT program
SLIDE 25 Controlling for Selection Bias
- An observational study (non-randomized)
- Patients in the S-OPAT and H-OPAT groups differed
- n several important measures.
– Healthcare funding (insurance, Medicare, Medicaid) – Language – Nationality and US citizenship – Educational level – Age
- These differences created a strong potential
for selection bias in the outcome.
- Must control for this in the analysis.
SLIDE 26 Two Approaches in a Multivariable Logistic Regression Analysis
- Enter Covariates into the multivariable analysis
- Enter a Propensity Score into the multivariable
analysis
SLIDE 27 Two Approaches in a Multivariable Logistic Regression Analysis
- Enter Covariates into the multivariable analysis
– Age – Sex – Race – Country of origin – Source of payment – Education level – Income
- Enter a Propensity Score into the multivariable
analysis
SLIDE 28 Two Approaches in a Multivariable Logistic Regression Analysis
- Enter Covariates into the multivariable analysis
– Age – Sex – Race – Country of origin – Source of payment – Education level – Income
- Enter a Propensity Score into the multivariable
analysis
Covariates control confounding, but not necessarily selection bias.
SLIDE 29 Two Approaches in a Multivariable Logistic Regression Analysis
- Enter Covariates into the multivariable analysis
– Age – Sex – Race – Country of origin – Source of payment – Education level – Income
- Enter a Propensity Score into the multivariable
analysis
Covariates control confounding, but not necessarily selection bias. A propensity score measures each patient’s propensity (probability) of receiving the treatment (S-OPAT) based on their characteristics.
SLIDE 30
- R. Haley, Epi for Clin Investigator
Propensity Score
- Definition: An individual patient’s probability
- f receiving the treatment conditional on
measured covariates.
– “How do you develop a propensity score?”
SLIDE 31
- R. Haley, Epi for Clin Investigator
Development of Propensity Score
– Instead of putting covariates into the main multivariable logistic regression model:
Outcome = Treatment Covar-1 Covar-2 . . . Covar-I (output is the odds ratio)
– Develop a logistic regression model of the treatment:
Treatment = Determinant-1 Determinant-2 . . . Determinant-I / pred=PS And output the probability of treatment conditional on the determinant
- variables. This is the PS (a continuous variable = probability of
treatment)
– Within the strata of the PS, the probability of getting the treatment is the same.
SLIDE 32 Development of Propensity Score
– Instead of putting covariates into the main multivariable logistic regression model:
Outcome = Treatment Covar-1 Covar-2 . . . Covar-I PS (output is the odds ratio)
– Develop a logistic regression model of the treatment:
Treatment = Determinant-1 Determinant-2 . . . Determinant-I / pred=PS And output the probability of treatment conditional on the determinant
- variables. This is the PS (a continuous variable = probability of
treatment)
– Within the strata of the PS, the probability of getting the treatment is the same.
SLIDE 33
- R. Haley, Epi for Clin Investigator
4 Ways to Use the Propensity Score
- PS Covariate Adjustment (most used):
– Introduce the PS into the multivariable logistic model of outcome as a new covariate.
– Stratify the outcome analysis on the PS.
– Match
– Weight the multivariable logistic model of
- utcome with the inverse PS.
SLIDE 34
SLIDE 35 Summary of Patient Selection
a Patients who were homeless, had a history of IV drug abuse, or were medically unstable b The eligibility criteria are given in the appendix of the paper.
a b
SLIDE 36 Logistic Regression Model of S-OPAT vs H-OPAT to Develop the Propensity Score
Outcome variable is S-OPAT vs H-OPAT
SLIDE 37 Multivariable Proportional Hazards Regression
Model of 30-day Readmission
Model 1 controls for confounding by entering covariates into the model.
SLIDE 38 Multivariable Proportional Hazards Regression
Model of 30-day Readmission
Model 1 controls for confounding by entering covariates into the model. The OR of 0.59 indicates that S-OPAT had a 41% lower 30- day readmission rate than H-OPAT. % reduction = 1 - OR
1 – 0.59 = 41% reduction
SLIDE 39 Multivariable Proportional Hazards Regression
Model of 30-day Readmission
Model 1 controls for confounding by entering covariates into the model. Model 2 also controls for selection bias by entering the propensity score into the model.
1 – 0.59 = 41% reduction
SLIDE 40 Multivariable Proportional Hazards Regression
Model of 30-day Readmission
Model 1 controls for confounding by entering covariates into the model. Model 2 also controls for selection bias by entering the propensity score into the model.
1 – 0.59 = 41% reduction 1 – 0.53 = 47% reduction
SLIDE 41 Multivariable Proportional Hazards
Regression Model of 1-Year Mortality
Model 1 controls for confounding by entering covariates into the model. Model 2 also controls for selection bias by entering the propensity score into the model.
1 – 0.94 = 6% reduction 1 – 0.86 = 14% reduction
SLIDE 42 Multivariable Proportional Hazards
Regression Model of 1-Year Mortality
Model 1 controls for confounding by entering covariates into the model. Model 2 also controls for selection bias by entering the propensity score into the model.
SLIDE 43 Readmissions During Infusion Period
Readmissions for reason: S-OPAT H-OPAT Related to IV infusion 21/944 ( 2.2%) 4/244 ( 1.8%) NS Unrelated 131/944 (13.9%) 49/244 (21.9%) NS
Reasons related to IV infusion 13 PICC line dysfunction 10 Underlying infection not improving 6 Renal or hepatic toxicity from antibiotic 4 Catheter-related bloodstream infection 1 Deep vein thrombosis
SLIDE 44 Impact of the S-OPAT Program on the Hospital’s Inpatient Bed Utilization
*Before the S-OPAT clinic was started, all of these days would have been spent in the hospital just to receive antimicrobial infusions.
*
SLIDE 45
30 day readmission 47% lower for “self-care” (S-OPAT) population vs pts receiving standard of care (H-OPAT)
27,666 inpatient days
avoided over 4 years
~ $40,000,000 saved
for hospital Improved resource utilization by freeing beds for acutely ill
SLIDE 46 What do Patients Value ?
- Ability to return to work earlier
- Ability to care for dependents at
home
- Avoid high cost of hospitalization
- Ability to complete therapy safely in
the comfort of home environment with minimal interruption of daily life
SLIDE 47
Patient-Centered Outcomes Survey
SLIDE 48 Lessons Learned
- S-OPAT model delivers safe and effective
care outside of the hospital setting.
- A multi-disciplinary approach is critical to
the successful implementation of this transition of care model.
- Systematic “teach-back” training and weekly
clinic followup important and cost-effective.
- Prior Perception vs Patients’ Ability to self
administer IV therapy through program of patient engagement and empowerment
SLIDE 49
Questions?