SLIDE 1
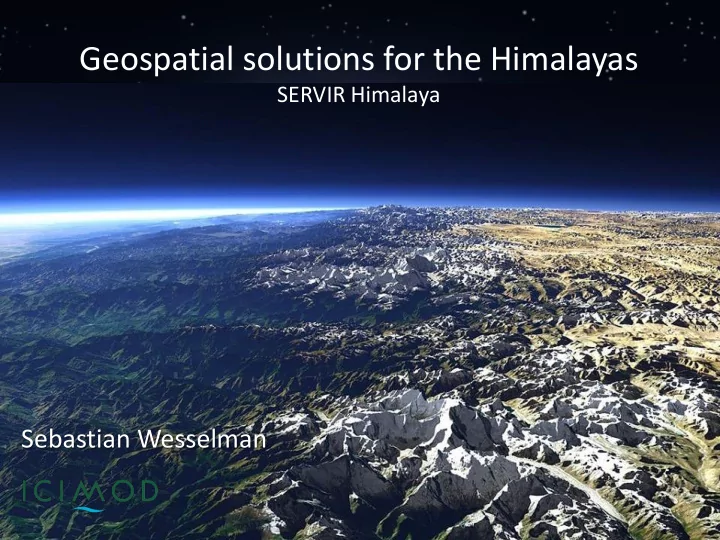
Sebastian Wesselman
Geospatial solutions for the Himalayas
SERVIR Himalaya
SLIDE 2
- The International Centre for Integrated
Mountain Development (ICIMOD) is working in Afghanistan, Bangladesh, Bhutan, China, India, Myanmar, Nepal and Pakistan
- Aim: Address challenges related to
globalization and climate change that affect mountain ecosystems and livelihoods
SLIDE 3 An area of majestic beauty – a world heritage site for biodiversity Sources of freshwater reserves - headwaters for 10 major river systems Great relevance of Earth Observation due to inaccessible conditions and lack of data
The Hindu Kush-Himalayan Region
Climate Change Demographic Change Land use Change Globalization Social Change
Increase adaptive capacity and resilience of mountain and downstream communities
SLIDE 4 SERVIR Facility at NASA SERVIR-Mesoamerica SERVIR-Africa SERVIR-Himalaya
USAID-NASA SERVIR Initiative
SERVIR ~ to serve
To improve environmental management and resilience to climate change by strengthening capacity of governments and key stakeholders to integrate EO and geospatial technologies into decision making for sustainable development
SLIDE 5 Questionnaire survey National Workshops Qualitative Modeling Pilot Applications In-situ Data EO Data GIS Data Knowledge Base Issues/ Priorities Thematic Applications Quantitative Modeling (Near) Real-time Information Interactive Mapping Decision Support Plan / Policy & Decision making Data Access and Sharing Capacity Building and Training SERVIR-Himalaya Platform Gap Analysis Tools and Methods Data and Information Priority Areas Stakeholder Consultations Spatial Analysis Data and Information Integration Framework Analysis and Modeling Visualization and web- based Platform Institutional Strengthening and networking
Framework for Science Applications and Information Systems
SLIDE 6
Earth Observation for sustainable mountain development Aligning with GEOSS Priority Areas
SLIDE 7
Cryosphere & Water
SLIDE 8
Cryosphere & Water
Glacier mapping Automated snow cover product Hydrological modeling Snow Melt Runoff Models National partners Basin level water management Ancillary data Product design verification Product use & application Tools adoption
SLIDE 9 Cryosphere & Water
- Glaciers Monitoring - decadal change 1980-2010
- Snow cover dynamics
Historic changes of Snow and Glaciers in the HKH
SLIDE 10 Monitoring changes in glaciers and glacier lakes
Image is a portion of an uncalibrated ASTER Level 1A VNIR false-color image (321RGB), acquired on November 20, 2001
Bhutan Himalaya Tibet Himalaya
SLIDE 11
Cryosphere & Water
SLIDE 12 Cryosphere & Water
- Hydrological modeling
- Climate change and water availability scenarios (Wanchu basin, Bhutan)
SLIDE 13
MODIS based automated snow cover monitoring
SLIDE 14
Ecosystems & Biodiversity
SLIDE 15
- Land cover change and GHGs
- Multi scale biomass modeling
- Phobjika habitat conservation
National Partners Field data support Product design verification Product use & application Tools adoption Forest cover reporting systems REDD MRV framework RAMSAR site monitoring system
Ecosystems & Biodiversity
SLIDE 16 Forest Land cover Nepal 2010
Remote sensing based approaches for REDD+ mechanism in community forestry of Nepal Multi resolution satellite data based biomass models for baseline carbon assessment and monitoring
Green house gas inventory (Forest carbon flux) Operational forest monitoring system
2010 2000 1990
SLIDE 17
Pragati , Janapragati and NibuwaterCommunity Forest
SLIDE 18
Pragati , Janapragati and NibuwaterCommunity Forest
SLIDE 19 Tree Crown Size Analysis
2002
Tree Crown Size 2002
<50 50-100 100-150 150-200 200-250 >250
2009
Tree Crown Size 2009
<50 50-100 100-150 150-200 200-250 250-300 300-350 >350
SLIDE 20 Multi-scale Biomass Modeling REDD MRV Framework
- To develop multi resolution satellite data based
biomass models for baseline carbon assessment and monitoring
- Spatial biomass models tested, under calibration
- Landsat TM Seasonal Multispectral
Reflectance
- GeoEye based Stand level canopy
Morphology
- GeoEye based Species level canopy
projected area
- MRV Spatial frame work being worked out
R2=0.7674
Landsat TM based Spatial Biomass map (Decision tree model) Parameter Variable Importance
SLIDE 21
Disasters & Natural Hazards
SLIDE 22
Disasters & Natural Hazards
Forest fire detection & monitoring Flood early warning system National Partners Near real time fire reporting system Flood early warning system Ancillary data Product design verification Product use & application Tools adoption
SLIDE 23 Earth Observation: Forest fire detection
SMS alert
SLIDE 24
Agriculture & Food Security
SLIDE 25
Agriculture & Food Security
In season crop monitoring Crop production assessment National Partners Agriculture Drought Warning system Crop Planning management Historical data Product design verification Product use & application Tools adoption
SLIDE 26 Crop Growth Monitoring and Production Assessment
In season crop growth monitoring Crop production assessment in peak of season
In season anomaly maps based on 10 years average vegetation conditions data within the agriculture areas of Nepal Establishing relation between crop production and Season Max. NDVI based on 10 years data for wheat crop
SLIDE 27
Air & Atmosphere
SLIDE 28
Air & Atmosphere
Automated Aerosol Monitoring Validation of MODIS Aerosol Data Air Quality and Health Satellite based air quality reporting system National Partners Ancillary data Product design verification Product use & application Tools adoption
SLIDE 29
MODIS based applications
SLIDE 30
Visibility and partnerships
SLIDE 31
Access to Information
SLIDE 32 Outreach and Capacity Building
- Symposium
- Workshops/Training
- Youth Forum
- Science Applications
Showcase
SLIDE 33
Youth Programme
SLIDE 34 Way forward
- Raise awareness and make use of the wealth
- f Earth Observation data
- Regional collaboration, exchange of data and
standardizing methodologies
- Capacity building
- Work with key partners to implement
geospatial solutions
SLIDE 35
Thank You...