
SLIDE 1
CSE P 590 A
Autumn 2008
Lecture 5 Motifs: Representation & Discovery
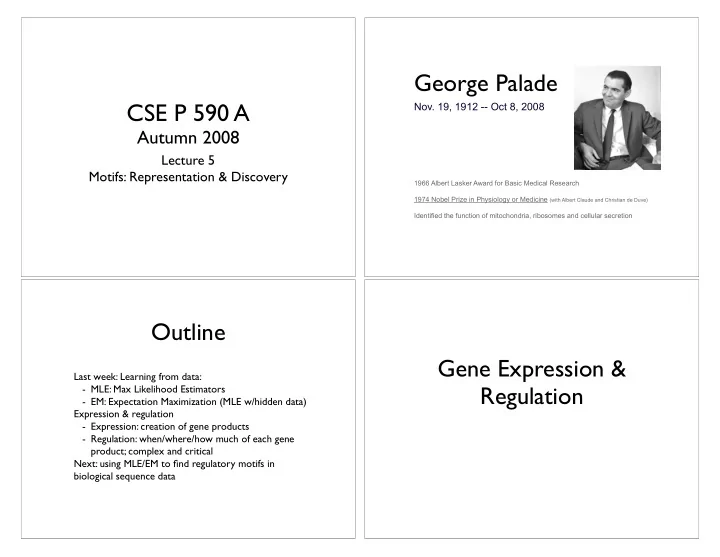
George Palade
- Nov. 19, 1912 -- Oct 8, 2008
1966 Albert Lasker Award for Basic Medical Research 1974 Nobel Prize in Physiology or Medicine (with Albert Claude and Christian de Duve) Identified the function of mitochondria, ribosomes and cellular secretion
Outline
Last week: Learning from data:
- MLE: Max Likelihood Estimators
- EM: Expectation Maximization (MLE w/hidden data)
Expression & regulation
- Expression: creation of gene products
- Regulation: when/where/how much of each gene
product; complex and critical Next: using MLE/EM to find regulatory motifs in biological sequence data