
SLIDE 1
Genetic structure of the Japanese and the formation of the Ainu - - PowerPoint PPT Presentation
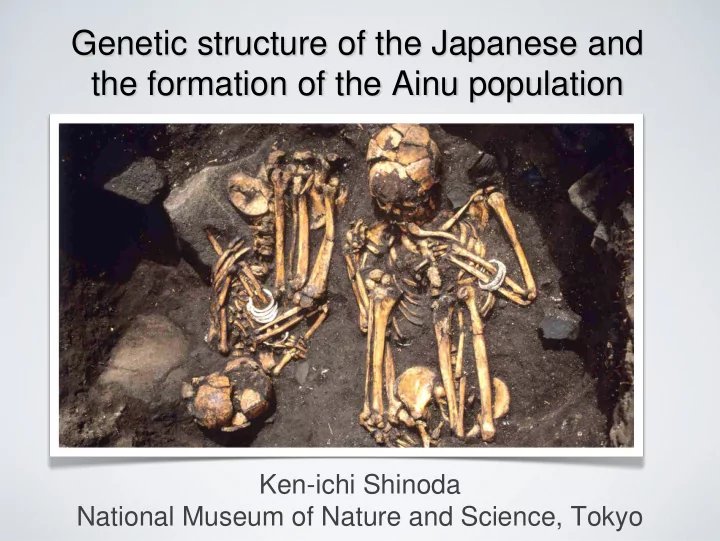
Genetic structure of the Japanese and the formation of the Ainu population Ken-ichi Shinoda National Museum of Nature and Science, Tokyo Mitochondrial DNA mitochondria Structures of mtDNA nuclear genome 3 billion 16,569 base pair History of
16,569 base pair
mitochondria
nuclear genome 3 billion
L
L1 L1 L0 L2 L3 L2 L3 M N
150,000-60,000 BP.
I U H JT R U N N N M M M N P Q A B D F My Mx Mz Nz
60,000-20,000 BP.
A B X C D A D B C A D A B X C D
20,000 BP.-
M7b M7a N9b
M7c
Frequency distribution of haplogroup D4 in each population
D4 Japan Korea Northern China
40,000 BP.
A.D. 300 B.C. 1,000 15,000 BP.
Immigrant Yayoi female Jomon female
For the Japanese individuals, there were two main clusters: the Hondo cluster (red plus signs) and the Okinawa cluster (green crosses).
Han Chinese Mainland Japanese Okinawa
The American Journal of Human Genetics 83, 445–456, October 10, 2008
1,700 BP. -
Palaeolithic to Jomon
40,000-12,000 BP.
(K. Hanihara 1991)
(Okhotsk 5-10 century)
3,000-1,700 BP.
M7a
M7 bc
M8
M8
M10
M7 bc
M
N9 a N9b
F
Y n= 1312 n= 78 n= 119
M8
N9a Z F
D4 D4h2 D5
D5
A
F
PLoS ONE 6(6): e21509. Initial population growth LGM Rapid population growth
5,000-4,000BP 10,000-6,000BP 6,000-5,000BP 40,00-30,00BP 3,000-30,00BP
Original place of rice agriculture 5000 BP. 3000 BP. 3000 BP.
M7a
M7 bc
M7bc
M8 M10
M7 bc
M
M
A N9 a N9b
N9b N9b
B
F
Y
Other F Other
n=1312 n=372 n=51
G
N9b G1b
D4h2
M7a
Hokkaido Jomon
N9b M7a
Tohoku Jomon
M7a N9b
Kanto Jomon
D4h2
B4 F
M7bc
M10 M8 D4 D4 M8 D4 A Z N9a B4 F
Kyushu Yayoi
G2 D5
Ainu Haplogroup G Haplogroup Y
Jomon to Epi-Jomon Satumon Ainu
Okhotsk culture
7th century 13th century B 2% G 25% M7a 16% D 18% N9b 8% M7b,c 4%
F 2% A 4% Y19%
Modern Ainu
D4h2 17% G1b 11%
M7a 7%
N9b 65%
Jomon Okhotsk culture
B4 3%
M7a 6%
G1b 24% A 8% N9b 11% Y 43%
C 5%
Recent Ainu (Edo era)
M7b 1%
B4 1% D4 9% M7a 5%
Z 1%
Y 33% N9b 21% G1b 10% A 7% C5a 4%
M8a 1% M9 1%
5th century 9th century