
1
1
Pre-mRNA Secondary Structure Prediction Aids Splice Site Recognition
Donald J. Patterson, Ken Yasuhara, Walter L. Ruzzo University of Washington Computational Molecular Biology Group
January 3-7, 2002 Pacific Symposium on Biocomputing
3
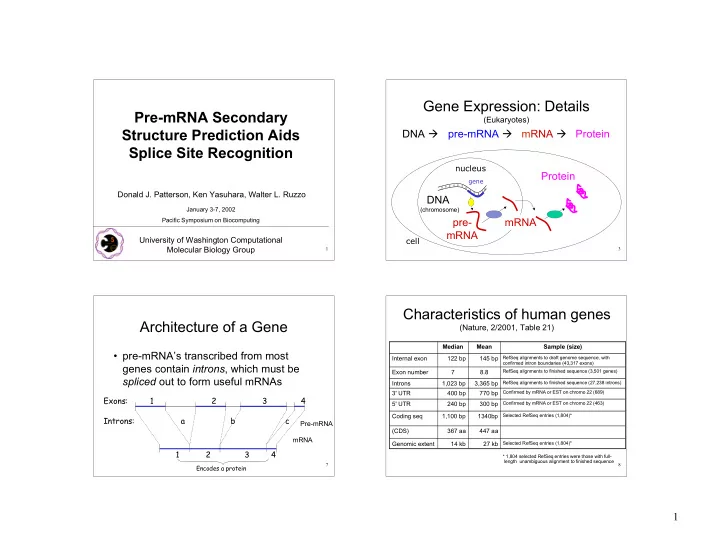
Gene Expression: Details
(Eukaryotes)
DNA pre-mRNA mRNA Protein DNA
(chromosome)
Protein
gene
cell
pre- mRNA
nucleus
mRNA
7
Architecture of a Gene
- pre-mRNA’s transcribed from most
genes contain introns, which must be spliced out to form useful mRNAs
Exons: 1 2 3 4 Introns: a b c 1 2 3 4
Pre-mRNA mRNA
Encodes a protein
8
Characteristics of human genes
(Nature, 2/2001, Table 21)
* 1,804 selected RefSeq entries were those with full- length unambiguous alignment to finished sequence Selected RefSeq entries (1,804)*
27 kb 14 kb Genomic extent 447 aa 367 aa (CDS)
Selected RefSeq entries (1,804)*
1340bp 1,100 bp Coding seq
Confirmed by mRNA or EST on chromo 22 (463)
300 bp 240 bp 5' UTR
Confirmed by mRNA or EST on chromo 22 (689)
770 bp 400 bp 3' UTR
RefSeq alignments to finished sequence (27,238 introns)
3,365 bp 1,023 bp Introns
RefSeq alignments to finished sequence (3,501 genes)
8.8 7 Exon number
RefSeq alignments to draft genome sequence, with confirmed intron boundaries (43,317 exons)
145 bp 122 bp Internal exon Sample (size) Mean Median