
SLIDE 1
4/3/09 1
CSCI1950‐Z Computa4onal Methods for Biology Lecture 16
Ben Raphael March 30, 2009
hHp://cs.brown.edu/courses/csci1950‐z/
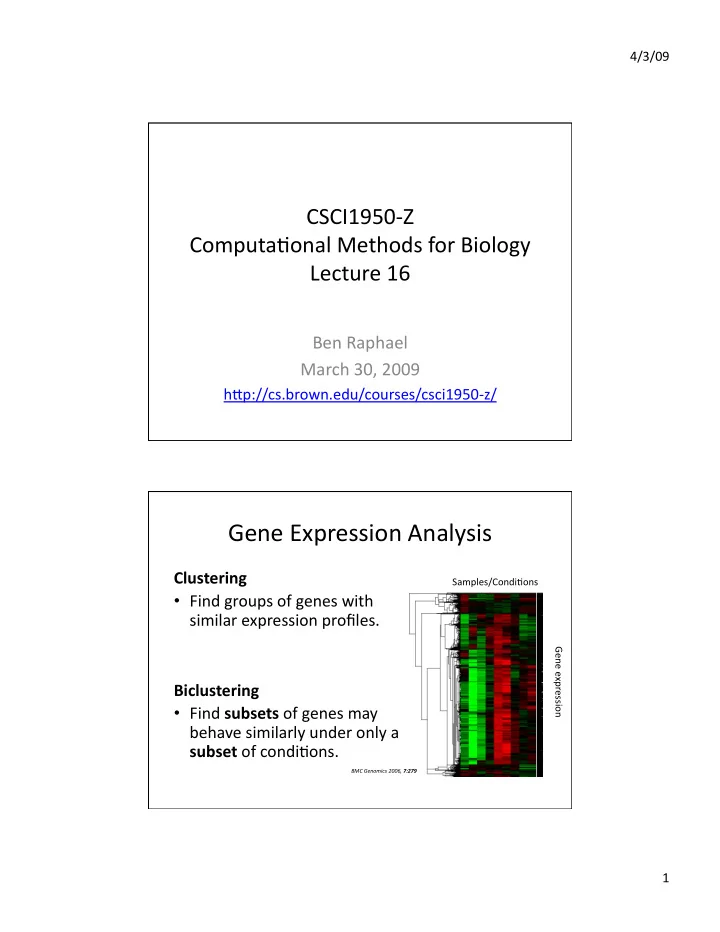
Gene Expression Analysis
Clustering
- Find groups of genes with
similar expression profiles. Biclustering
- Find subsets of genes may
behave similarly under only a subset of condi4ons.
Gene expression Samples/Condi4ons
BMC Genomics 2006, 7:279