
SLIDE 1
Gene$c architecture of adult height through GWAS
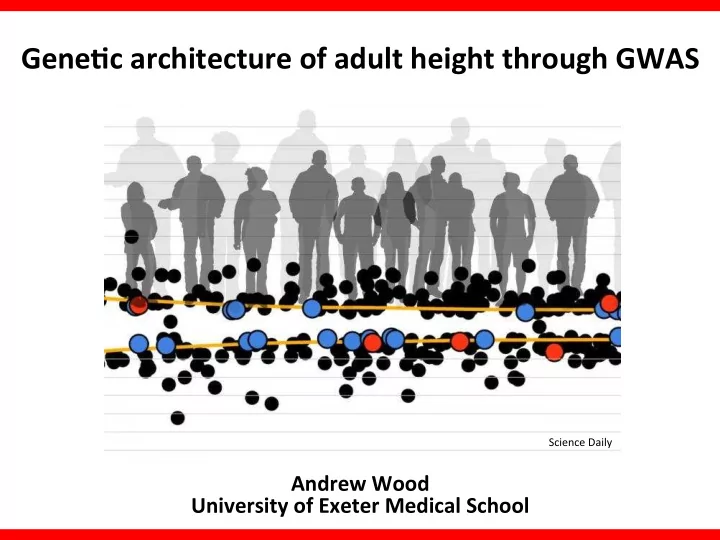
Andrew Wood University of Exeter Medical School
Science Daily
Gene$c architecture of adult height through GWAS Science Daily - - PowerPoint PPT Presentation
Gene$c architecture of adult height through GWAS Science Daily Andrew Wood University of Exeter Medical School Studies consistently es$mate that the addi$ve gene$c contribu$on to normal varia$on in adult height is approximately 80% Classical
Science Daily
Classical twin studies Compare concordance between MZ & DZ twins, where twins separated at birth
MZ DZ
A/a A/A a/a
SNP Genotype
Trait Number of variants Crohn’s disease* 3-4 Blood Lipid levels 4-5 Type 2 diabetes 3 Type 1 diabetes* 2 Eye/skin/hair colour 1 Alzheimer’s disease 1 Folate levels, Neural Tube Defects 1 Height *In addi;on to the HLA locus for autoimmune related diseases
~0.4cm per effect allele = ~0.3% total variance 365K directly genotyped SNPs Discovery N = 5,000
Ligon et al. 2005 Zhou et al. 1995
October 2007
Discovery N = 15,000 Discovery N = 14,000 Discovery N = 27,000
N = 1,900 N = 4,900 N = 6,800 N = 8,700 N = 12,200 N = 13,600 Adapted from Weedon, et al. (May 2008)
ACTG, ADVANCE, AE, AGES, AMC-PAS, AMISH, ARIC, ASCOT, BC58, BHS, BLSA, B-PROOF, BRIGHT, CAHRES, CARDIOGENICS, CHS, CoLaus, CROATIA, D2D, deCODE, DESIR, DIAGEN, DILGOM, DGI, DNBC, DPS, DR’S EXTRA, DUNDEE, EAS, EGP, EGCUT, ELY, EMIL, EPIC, ERF, FamHS, FENLAND, FHS, FramHS, FTC, FUSION, GASP1&2, GenMets, GerMiFS1&2, GLACIER, HEALTH ABC, HERITAGE, HNR, HUNT, HYPERGENES, IMPROVE, InCHIANTI, IPM, KORA3&4, LEIPZIG, LifeLines, LLS, LOLIPOP, LURIC, METSIM, MICROS, MIGEN, MORGAM, NELSON, NFBC, NHS, NSHD, NSPHS, NTR-NESDA, ORCADES, PIVUS, PLCO, PREVEND, PROCARDIS, PROSPER/PHASE, QFS, QIMR, RISC, ROTTERDAM, RUNMC, SardiNIA, SEARCH, SHIP, SHIP-TREND, STR, THISEAS, TRAILS, TROSMØ, TwinsUK, TWINGENE, ULSAM, WHITEHALL, WTCCC-CHD, WTCCC-UKBS, WTCCC-T2D
GWAS/Custom SNP Chips 300k-1M Imputa;on Haplotype Reference Consor;um (v1 released summer 2015) ~2.5M SNPs
~81M variants (Oct 2014)
Lango Allen, et al. October 2010 Discovery N: 133,000 180 regions with SNP P<5x10⁻⁸ 10% phenotypic varia$on 12.5% heritability
!
Discovery N: 253,000 423 regions with SNP P<5x10⁻⁸ 16% phenotypic varia$on 20% heritability Wood, et al. October 2014
Wood, et al. 2014
– Meta-analysis summary sta;s;cs adjusted for LD structure defined by ~600K SNPs in 8,682 Europeans
Wood, et al. 2014
height ~ SNPA [+ x2 + x3 + … + xN] height ~ SNPB [+ x2 + x3 + … + xN]
height ~ SNPA + SNPB [+ x2 + x3 + … + xN]
Significance aher condi$oning Haplotypes Present
+ trait raising allele Correla$on over Haplotypes Same – + – – + – + + None Jump – + + – Nega$ve Fall – – + + Posi$ve
Wood et al., Hum Mol Genet, 2011
height ~ SNPA [+ x2 + x3 + … + xN] height ~ SNPB [+ x2 + x3 + … + xN]
height ~ SNPA + SNPB [+ x2 + x3 + … + xN]
Significance aher condi$oning Haplotypes Present
+ trait raising allele Correla$on over Haplotypes Same – + – – + – + + None Fall + +
Posi$ve
Wood et al., Hum Mol Genet, 2011
height ~ SNPA [+ x2 + x3 + … + xN] height ~ SNPB [+ x2 + x3 + … + xN]
height ~ SNPA + SNPB [+ x2 + x3 + … + xN]
Significance aher condi$oning Haplotypes Present
+ trait raising allele Correla$on over Haplotypes Same – + – – + – + + None Fall + +
Posi$ve Jump + -
Nega$ve
Wood et al., Hum Mol Genet, 2011
Jumpers Fallers
pre-condi;onal post-condi;onal nega$ve correla$on of alleles between SNPs + -
posi$ve correla$on of alleles between SNPs
Wood et al., Hum Mol Genet, 2011
+ +
70 60 50 40 30 20 10 TwinGene Threshold P value
a
Vg Ve Cg + Ce 5 . × 1
–8
5 . × 1
–7
5 . × 1
–6
5 . × 1
–5
5 . × 1
–4
5 . × 1
–3
Framingham Variance and covariance (%) 70 60 50 40 30 20 10 Threshold P value
c
Vg Ve Cg + Ce 5 . × 1
–8
5 . × 1
–7
5 . × 1
–6
5 . × 1
–5
5 . × 1
–4
5 . × 1
–3
QIMR Variance and covariance (%) 70 60 50 40 30 20 10 Threshold P value
b
Vg Ve Cg + Ce 5 . × 1
–8
5 . × 1
–7
5 . × 1
–6
5 . × 1
–5
5 . × 1
–4
5 . × 1
–3
Variance Components: Vg = accumulated variance through real SNP effects Ve = accumulated variance due to errors in es;ma;ng SNP effects Wood, et al. 2014
P-value threshold Variance Explained 5x10-08 16% 5x10-03 29% Common SNPs 50%
7,768 children At age 10, the allele score was associated with a 0.16cm increase (P=6x10-90) ~5% of the variance explained at age 10
Manolio et al., Nature, 2009
Manolio et al., Nature, 2009
697 signals 423 loci ~20% h2
Manolio et al., Nature, 2009
Manolio et al., Nature, 2009
Genotyping | Imputa$on | Sequencing 697 signals 423 loci ~20% h2
32 rare variants (MAF<1%) 51 low-frequency variants (MAF 1-5%) 34 new loci 2x10⁻⁷ Common Low frequency Rare
Marouli et al. Nature, 2017 Exome Chip 240k variants ~83% coding with MAF ≤ 5% Discovery 147 EC studies N=458,927 Replica$on 8 EC studies + deCODE + UK Biobank N=252,501 Meta-analysis N = 711,428 1.37% variance ~1.7% h2
Marouli et al. Nature, 2017
STC2 reduces levels of insulin-like growth factors Previous studies have shown over-expression of STC2 diminishes growth in mice STC2 inhibits the proteinase PAPP-A that cleaves IGF binding protein-4 (IGFBP-4) that acts as a transporter for IGF I and IGF II Two rare coding STC2 variants associated with height from exome-chip analysis rs148833559 p.Arg44Leu MAF=0.10% increases height by 2.1cm/allele rs146441603 p.Met86Ile MAF=0.14% increases height by 0.9cm/allele Marouli et al. Nature, 2017 Disrupt STC2 PAPP-A IGF1
Associated GWAS Height variants occur in or near monogenic skeletal/growth genes much more ohen than expected by chance
180 loci iden$fied by Lango Allen et al. contained 652 genes 21 of 241 genes associated with known skeletal growth syndromes (P<0.001) 13/21 genes whereby growth disorder gene closest to index height SNP 9/13 whereby index height SNP is located within gene region itself
Lango Allen, et al. 2010
Gene Syndrome Category Gene Syndrome Category ACAN Spondyloepimetaphyseal dysplasia Short stature IGF1R Insulin-like growth factor I resistance Short stature ADAMTS10 Weill-marchesani Syndrome 1 Short stature IHH Acrocapitofemoral dysplasia Short stature DYM Dyggve-Melchior-Clausen disease Short stature NOG Mul;ple synostosis syndrome 1 Short stature EIF2AK3 Wolcov-Rallison Short stature NSD1 Beckwith-Wiedemann Overgrowth FANCE Fanconi Anemia,
Short stature PTCH1 Basal cell nevus Overgrowth GDF5 Acromesomelic Dysplasia Short stature RNF135 Macrocephaly Overgrowth GH1 Growth Hormone Deficiency Short stature RPL5 Diamond–Blackfan anemia Short stature GHSR Short Stature Short stature RUNX2 Cleidocranial dysostosis Short stature GNPTAB Mucolipidosis Short stature SLC39A13 Spondylocheirodysplasia, Ehlers-danlos Short stature HMGA2 Leiomyoma Overgrowth
Lango Allen, et al. 2010
Pathway / Func$on Genes ≤300kb From Height SNPs Hedgehog signalling (embryonic development) BMP6, IHH, PTCH1, WNT6, WNT9A, FBXW11, HHIP, WNT10A, WNT3A TGF-β signalling (cellular prolifera$on & differen$a$on) AMH, BMP6, ID4, LTBP1, TGFB1, TGFB2, TNF, GDF5, CUL1, NOG MAPK (cellular response to s$muli) ARRB1, CACNB1, CHUK, FGFR3, FGFR4, GNA12, MKNK2, MEF2C, MAP3K3, MOS, GADD45B, NF1, NFATC4, PPM1A, MAPK9, MAP2K3, RASA2, RPS6KA1, TGFB1, TGFB2, TNF, MAP3K14, RASGRP3 Apoptosis (cell death) BOK, CMA1, CTSG, GZMH, GZMB, LTA, LTB, TNFSF10, MAP3K14, RIPK3 An$gen processing & presenta$on HLA-B, HLA-C, HLA-DMA, HLA-DMB, HLA-DOB, HLA-DQA1, HLA-DQA2, HLA- DQB1, HLA-DRA, HLA-DRB1, HLA-DRB5, LTA, PSME1, PSME2, TAP1, TAP2 Extracellular matrix ACAN, FBLN2, EFEMP1, GPC5, GP9, LTBP1, LTBP2, LTBP3, MFAP2, MSLN, FBLN5, EFEMP2, ADAMTSL3, HAPLN3, SCUBE3, MPFL
Lango Allen et al. 2010
coding variants - pathways specific to skeletal growth (ECM and bone growth) non-coding variants - more global biological processes (e.g. transcription factor binding)
Marouli et al. Nature, 2016
12 11 10 9 8 7 6 5 4 3 2 1 Endocrine Hemic and immune Integumentary Musculoskeletal Nervous Respiratory Stomatognathic Urogenital Physiological system Arteries Pancreas –log10 (P value) Serum Cartilage Joints Spine Lung Fallopian tube Cardiovascular Digestive Endocrine glands
Wood, et al. 2014
A/A A/B B/B SNP 2
Genotype class effect max min
A/A A/B B/B A/A A/B B/B A/A A/B B/B A/A A/B B/B A/A A/B B/B A/A A/B B/B A/A A/B B/B A/A A/B B/B A/A A/B B/B A/A A/B B/B A/A A/B B/B A/A A/B B/B A/A A/B B/B A/A A/B B/B A/A A/B B/B A/A A/B B/B SNP 2 SNP 2 SNP 1 SNP 1
Genotype class effect max A/A A/B B/B A/A A/B B/B min
Lango Allen, et al. 2010
doi:10.1038/nature13005
Detection and replication of epistasis influencing transcription in humans
Gibran Hemani1,2, Konstantin Shakhbazov1,2, Harm-Jan Westra3, Tonu Esko4,5,6, Anjali K. Henders7, Allan F. McRae1,2, Jian Yang1, Greg Gibson8, Nicholas G. Martin7, Andres Metspalu4, Lude Franke3, Grant W. Montgomery7*, Peter M. Visscher1,2* & Joseph E. Powell1,2*
Genetic interactions affecting human gene expression identified by variance association mapping Kerrin S Small, Timothy D Spector, Emmanouil T Dermitzakis, Richard Durbin Andrew A Brown, Alfonso Buil, Ana Viñuela, Tuuli Lappalainen, Hou-Feng Zheng, John B Richards,
30 pairwise interac$ons 19 cis-cis (19 genes) 11 cis-trans (2 genes) 57 cis-cis interac$ons (48 genes) Hemani et al, Nature, 2014 2014
CSTB FN3KRP ADK
r2 = 0.04 D’ = 0.23 r2 = 0.00 D’ = 0.04 r2 = 0.00 D’ = 0.01
FN3KRP CSTB ADK
r2 = 0.04 D’ = 0.23 r2 = 0.00 D’ = 0.04 r2 = 0.00 D’ = 0.01
FN3KRP CSTB
r2 = 0.04 D’ = 0.23 r2 = 0.00 D’ = 0.04 r2 = 0.05 D’ = 0.25 r2 = 0.14 D’ = 0.38 r2 = 0.01 D’ = 0.12 r2 = 0.05 D’ = 0.27
ADK
r2 = 0.00 D’ = 0.01 r2 = 0.10 D’ = 1.00 r2 = 0.39 D’ = 0.81
Gene (chr) SNP1 SNP2 Strongest addi$ve cis SNP Interac$on P (pre-condi$oning) Interac$on P (post-condi$oning) FN3KRP (17) rs898095 rs9892064 17:80678628 3E-12 0.43 CSTB (21) rs9979356 rs3761385 21:45201832 8E-07 0.99 MBLN1 (3) rs16864367 rs13079208 3:152182577 3E-06 0.16 TMEM149 (19) rs807491 rs7254601 19:36234489 3E-06 0.41 CTSC (11) rs7930237 rs556895 11:88015717 5E-06 0.04 NAPRT1 (8) rs2123758 rs3889129 8:144684215 6E-06 0.84 LAX1 (1) rs1891432 rs10900520 1:203747772 2E-04 0.52 PRMT2 (21) rs2839372 rs11701058 21:47887791 3E-04 0.3 ADK (10) rs2395095 rs10824092 10:75928933 9E-04 0.86 C21ORF57 (21) rs9978658 rs11701361 21:47703649 7E-03 0.43 ATP13A1 (19) rs4284750 rs873870 19:19756073 8E-03 0.64
Wood et al, Nature, 2014
Weedon, et al. (2008) assumes addi$ve mode of inheritance where effects are fixed across the en$re distribu$on
WASs = g = {0,1,2} w = standardized allele effect
Individuals with phenotypic extremes place larger burden on health care Detec;ng individuals that deviate from a polygenic model may mean we can priori;ze them sequencing and poten;ally clinical ac;on
10 20 30 40 50 50 40 30 20 10 Lower Tail (%) Upper Tail (%)
Aher repeated simula$ons, we obtain a distribu$on of weighted allele scores for a given tail under a null model
Average expected azer simula;ons Average expected azer simula;ons
5.59 5.75 5.91 5.59 5.75 5.91
Devia;on from expecta;on may be indica;ve of: 1) an enrichment of individuals who do not follow expected polygenic inheritance 2) gene x environment interac;ons 3) 1&2 above
10 20 30 40 50 50 40 30 20 10 Lower Tail (%) Upper Tail (%)
Average expected azer simula;ons Average observed Average expected azer simula;ons Average observed
We can compare the observed average height WAS within a given percen$le
5.59 5.75 5.91 5.59 5.75 5.91
Devia;on from expecta;on may be indica;ve of: 1) an enrichment of individuals who do not follow expected polygenic inheritance 2) gene x environment interac;ons 3) 1&2 above
Taking 697 SNPs associated with height we see that there is an excess of height increasing alleles in the lower end of the height distribu$on in the UK Biobank
10 20 30 40 50 50 40 30 20 10 10 20 30 40 50 50 40 30 20 10 Lower Tail (%) Upper Tail (%)
Average expected azer simula;ons Average observed Average expected azer simula;ons Average observed
5.59 5.75 5.91 5.59 5.75 5.91
6 12 6 12
Females: 126cm to 149cm; Males 133cm to 159cm
Distribu$on of average WAS in shortest 0.25% aher 10,000 simula$ons Simula;on Count Average Weighted Allele Score
10 20 30 40 50 10 20 30 40 50 Lower Tail (%)
Average expected azer simula;ons Average observed
P=9x10⁻¹⁰
5.5 5.6 5.7 5.8 5.9 6.0 5.49 5.51 5.53 5.55 5.57 5.59 500 1000 1500
2 4 6
P=9x10⁻¹⁰ P=0.99 Shortest 0.25% Tallest 0.25%
Average Weighted Allele Score Average Weighted Allele Score Simula;on Count Simula;on Count
500 1000 1500 500 1000 1500 5.49 5.51 5.53 5.55 5.57 5.59 5.91 5.93 5.95 5.97 5.99
2 4
Weighted Allele Score (Z)
2 4
Height (Z)
2/3 Turner’s Syndrome (female X), 3/4 Achondroplasia (FGFR3), 1/1 Spondyloepiphyseal dysplasia (COL2A1)
Weighted Allele Score (Z) Height (Z)
0.25%
2 4
2 4
Several hundred variants now known to influence normal adult height – 0 to 423 regions of the genomes iden;fied through GWAS – Evidence that SNPs associated with height affect birth length and growth rate in children – 35% of height loci contain mul;ple signals (697 signals iden;fied) – 84 newly iden;fied low frequency and rare variants in 34 novel loci – Associa;ons cluster among biologically relevant genes associated with growth disorders – Genes fall within biologically relevant pathways and highly expressed in ;ssues related to car;lage and bone as well as other ;ssues – No evidence of interac;on between SNPs associated with height to date – Large-scale datasets now make it possible to dig deeper into phenotypic distribu;ons to determine whether the standard addi;ve model holds across a phenotypic distribu;on.