
SLIDE 1
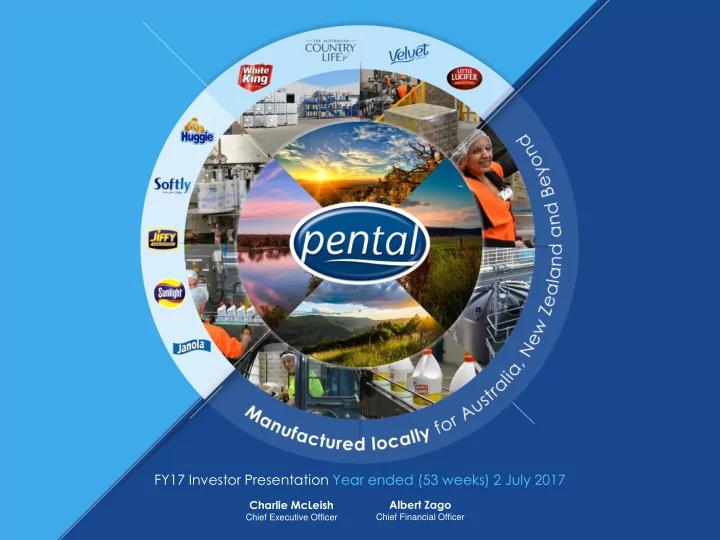
FY17 Investor Presentation Year ended (53 weeks) 2 July 2017
Charlie McLeish
Chief Executive Officer
Albert Zago
Chief Financial Officer
FY17 Investor Presentation Year ended (53 weeks) 2 July 2017 Charlie - - PowerPoint PPT Presentation
FY17 Investor Presentation Year ended (53 weeks) 2 July 2017 Charlie McLeish Albert Zago Chief Executive Officer Chief Financial Officer Agenda About Pental Financial Overview Operational Update Outlook Appendix 2 Manufactured locally for
FY17 Investor Presentation Year ended (53 weeks) 2 July 2017
Charlie McLeish
Chief Executive Officer
Albert Zago
Chief Financial Officer
Manufactured locally for Australia, New Zealand and Beyond – FY17 Investor Presentation
2
About Pental Financial Overview Operational Update Outlook Appendix
Manufactured locally for Australia, New Zealand and Beyond – FY17 Investor Presentation
3
4
Manufactured locally for Australia, New Zealand and Beyond – FY17 Investor Presentation
efficient and quality-tested to help families live better.
Australian home today it would be odd not to find at least one Pental product.
providing our customers with products of superior quality continues with constant product innovation and improvements.
families for generations.
Pental brands deliver quality and expertise in home and hygiene products for today’s lifestyle.
5
Manufactured locally for Australia, New Zealand and Beyond – FY17 Investor Presentation
Household Cleaning Private Label Personal Care Dishwash Laundry Care Fire Oral Care
Personal Care Laundry Care Fire Needs Household Cleaning
(New Zealand) (New Zealand)
6
Manufactured locally for Australia, New Zealand and Beyond – FY17 Investor Presentation
Substantial Shareholders(1)
Alan Johnstone - 21.9% Allan Gray Australia - 13.8% John Homewood – 12.6% Elevation Capital Management – 8.5%
Board of Directors & Company Secretary
Peter Robinson
Non Executive Independent Chairman
Mel Sutton
Non Executive Vice Chairman
John Rishworth
Non Executive Independent Director
John Etherington
Non Executive Independent Director
Kimberlee Wells
Non Executive Independent Director
Oliver Carton
Company Secretary
Charlie McLeish
CEO
Albert Zago
CFO
(1) As at 16 August 2017
Senior Management
7
Manufactured locally for Australia, New Zealand and Beyond – FY17 Investor Presentation
Market Cap: $81 Million(1) Pental Limited (ASX:PTL) Headquartered in Melbourne Established 63 years ago
Australia 81% New Zealand 18% Asia 1%
Gross Sales by Region
Auckland (NZ), Shanghai FTZ (China) and Ningbo FTZ (China)
Manufacturing facilities
(1) As of 2 July 2017
Distribution Channels Warehousing
8
Manufactured locally for Australia, New Zealand and Beyond – FY17 Investor Presentation
CREATE A SOLID PLATFORM FOR GROWTH:
Nail the basics: Safety, People Engagement, Environment, Quality & Customer Service Install cost effective high performance capability
DRIVE YEAR ON YEAR REAL PRODUCTIVITY SAVINGS OUR BRANDS DRIVE INNOVATION
Build strategic alliances with category leaders to access customer insights and innovation pipeline Optimise pack and price in the right Channel Drive innovation
ACCELERATE OUR CAPABILITY TO GROW THE EXPORT BUSINESS NEW CHANNELS
Establish new sales channels. Commercial and industrial.
8
Manufactured locally for Australia, New Zealand and Beyond – FY17 Investor Presentation
Manufactured locally for Australia, New Zealand and Beyond – FY17 Investor Presentation
9
Manufactured locally for Australia, New Zealand and Beyond – FY17 Investor Presentation
10
Dividend Up
Manufacturing Labour
(net recoveries) down on 9.1%
increased volume produced
Improved profitability
Net Sales up (Gross Sales up 7.0%) Profit Delivery Projects White King growth
Underlying EBIT up to $8.5m
Asia sales growing steady
Underlying EBITDA up to $11.9m
11
Manufactured locally for Australia, New Zealand and Beyond – FY17 Investor Presentation
$’000 FY17 FY16 Change % Gross Sales (GSV) 117,660 109,980 7,680 7.0% Net Sales 85,124 79,223 5,891 7.4% Underlying EBITDA (i) 11,923 10,834 1,089 10.1% Underlying EBITDA to gross sales
(i)
10.13% 9.85% Depreciation (3,376) (2,552) (824) Underlying EBIT (i) 8,547 8,282 265 3.2% Underlying EBIT to GSV(i) 7.26% 7.53% Reported NPAT 5,850 5,628 222 3.9% Basic EPS (cents) 4.29 4.13 3.8% Dividend Per Share (cents) 3.25 2.95 10.2%
(Net Sales up 6.3%)
1.3% (net Sales up 4.6%)
$0.66m & HY2: $1.14m
stock shortage/ DIFOT issues. Profit impact ~$0.5m plus delayed new product launches
(Gains LY) would be up 11.2% or $8.9m.
still ongoing
depreciation of $0.8m – capital investment
(i) Before one-off: ACCC legal costs
12
Manufactured locally for Australia, New Zealand and Beyond – FY17 Investor Presentation
sales up 7.7%
down 4.6% (or 2.1% in NZD)
steady grow Manufacturing Labour (after recoveries) down 28.7% Offset by Continuous Improvement Engineer, Sales support for new channels & manning for consolidated warehousing Trade spend increase in line with sales growth. At 27.7% of Gross Sales vs LY 28.0% Additional depreciation from capital investment
Service
consolidation of warehouses LY
Effective tax rate 29.9% vs LY H1 31.5% - R&D adjustment ACCC Dispute – Legal Costs Ongoing improvement in logistics even with increased sales volume Refocus activity in Promotional/ Trade spend & delayed launch
FX loss $385k vs $252k gain LY
5,628 2,000 4,000 6,000 8,000 10,000 12,000
NPAT FY16 Gross margin before trade spend Trade rebates & discounts Employee expenses Freight & distribution Marketing Development & Amortisation Other expenses & revenue FX (loss)/gain One off costs Finance costs Tax NPAT FY17
4,073 1,789 279 184 403 824 866 637 160 20 97 5,850
13
Manufactured locally for Australia, New Zealand and Beyond – FY17 Investor Presentation
Net cash position of $11.7m
property – settlement occurred on 2 August 2017
upgrade and non-bleach liquids
Banking facility of $5 million
Working capital increased by $0.9m:
activities in 1st Qtr. FY18
$’000 FY17 FY16 Cash 11,660 12,335 Net assets 84,960 83,177 Net debt / equity 0% 0%
Key Balance Sheet Items
$’000 FY17 FY16 Trade & other receivables 23,613 23,582 Inventories 10,297 8,866 Trade & other payables (17,242) (16,659) Working capital 16,668 15,789
Working Capital
14
Manufactured locally for Australia, New Zealand and Beyond – FY17 Investor Presentation
$’000 FY17 FY 16 Change Cash from operating profit after tax 9,259 8,264 995 Decrease/(increase) in working capital & other (812) 857 (1,669) Increase/(decrease) in net tax liability (1,832) 2,138 (3,970) Cash flow from operating activities 6,615 11,259 (4,644) Capital expenditure (3,066) (6,148) (3,082) Dividend paid (4,224) (3,816) (408) Net increase/(decrease) in cash (675) 1,295 (1,970) Net cash position at end of year 11,660 12,335 (675)
& monthly payment of FY17 tax estimate
increased safety stocks after DIFOT issues in second half and additional stock to cover promotional activities in 1st Qtr. FY18
plant and IT equipment
Manufactured locally for Australia, New Zealand and Beyond – FY17 Investor Presentation
15
16
Manufactured locally for Australia, New Zealand and Beyond – FY17 Investor Presentation
Eliminate low value activities & drive costs out
On track and continues to be a key focus
Preventative Maintenance
Plant reliability needs to improve
Production Lines Efficiency
Progressively improving
DIFOT Now back
Capital Work
Business case must be solid
Living Our Values: Safety Customers Innovation People Quality
17
Manufactured locally for Australia, New Zealand and Beyond – FY17 Investor Presentation
White King Soakers continue to grow strongly in Woolworths through the implementation of a new key pricing strategy 24.3% growth
*Source: Aztec Scan data, Value, MAT to 28/5/2017
Strong Growth:
White King 6.3% Toilet Cleaner 11.9% Household 5.9%
18
Manufactured locally for Australia, New Zealand and Beyond – FY17 Investor Presentation
Pental venture into non-bleach liquids with the launch of two new products
19
Manufactured locally for Australia, New Zealand and Beyond – FY17 Investor Presentation
20
Manufactured locally for Australia, New Zealand and Beyond – FY17 Investor Presentation
Little Lucifer and Jiffy are best performing fire brands in the grocery channel*
Pental is the
manufacturer in Australia
*Source: Aztec Scan data, Value, MAT to 28/5/2017
NEW Eco Fire Sticks 12 Pack Little Lucifer re-positioned to target the ‘Foodie’ trend
21
Manufactured locally for Australia, New Zealand and Beyond – FY17 Investor Presentation
Celebrating our Heritage since 1900
Pental launch 3 new products into China promoting our brand heritage.
22
Manufactured locally for Australia, New Zealand and Beyond – FY17 Investor Presentation
No other bar soap can claim to be locally and ethically made with 100% Australian ingredients – by an Australian owned company – for Australians for over 60 years.
All natural ingredients From the farm to the supermarket shelf
v
23
Manufactured locally for Australia, New Zealand and Beyond – FY17 Investor Presentation
New Sunlight 2 Litre Dishwashing Liquid
Growing profitable sales through product differentiation
Sunlight has maintained it’s strong position within the highly competitive NZ Manual Dish Wash Category and now leveraging of the brand to move into a new category for Pental - Dishwashing tablets
24
Manufactured locally for Australia, New Zealand and Beyond – FY17 Investor Presentation
As one of New Zealand’s most trusted brands, Janola continues to grow its reach within New Zealand households with the launch of Mould & Scum Trigger Spray and In-bowl Toilet Hangers
25
Manufactured locally for Australia, New Zealand and Beyond – FY17 Investor Presentation
White King’s loudest fan Western Bulldogs
(almost double club average of 4.95 million)
more live broadcast of Bulldogs games
attendance numbers are up 237% in 2017 compared to previous year
night games – on average, the most watched game of all in the current 2017 fixture by a whopping 155%
more replays available to more viewers i.e. greater viewer numbers overall
26
Manufactured locally for Australia, New Zealand and Beyond – FY17 Investor Presentation
from breast cancer by 2030
be donated to NBCF – Total $300,00
27
Manufactured locally for Australia, New Zealand and Beyond – FY17 Investor Presentation
Pental and White King are proudly sponsoring Shepparton’s premier Business Awards in 2018 and 2019.
The Awards celebrates 23 years of business awards’ success in the community, with 100+ nominees per annum. The growth of the Business Awards has seen new categories introduced over the years including Business of the Year, Customer Service of the Year, Best New Business across three mediums - Professional, Trade and Retail.
28
Manufactured locally for Australia, New Zealand and Beyond – FY17 Investor Presentation
Growing our presence in China & beyond:
Creating a solid platform for Growth:
Trade Zones for warehousing and distribution
products, pricing, risk management with selective partners
Focus areas:
information for retailers & consumers
29
Manufactured locally for Australia, New Zealand and Beyond – FY17 Investor Presentation
Distribution channels
30
Manufactured locally for Australia, New Zealand and Beyond – FY17 Investor Presentation
E-Commerce:
31
Manufactured locally for Australia, New Zealand and Beyond – FY17 Investor Presentation
New range of industrial-sized cleaning products: 5 to 15 litres Long-term expansion
channels with our power brands
Manufactured locally for Australia, New Zealand and Beyond – FY17 Investor Presentation
32
33
Manufactured locally for Australia, New Zealand and Beyond – FY17 Investor Presentation
MANUFACTURING CONTINUOUS IMPROVEMENT
stoppages
BRANDS & DEVELOPMENT OF NEW PRODUCTS
communication channels
DRIVE PROFITABLE SALES GROWTH IN KEY CHANNELS
Foodservice
NEXT PHASE OF CAPITAL WORKS
EXPORT GROWTH
growth in China
33
Manufactured locally for Australia, New Zealand and Beyond – FY17 Investor Presentation
Manufactured locally for Australia, New Zealand and Beyond – FY17 Investor Presentation
34
35
Manufactured locally for Australia, New Zealand and Beyond – FY17 Investor Presentation
$’000 FY 17 FY 16 % Change Gross sales (GSV) 117,660 109,980 7.0% Trade spend (32,536) (30,747) 5.8% Net Sales 85,124 79,233 7.4% Raw materials, consumables & change in inventory (44,625) (41,294) 8.1% Freight out & distribution (6,373) (6,557)
Employee expenses (12,946) (12,667) 2.2% Marketing expenses (2,462) (2,865)
Other expenses & revenue (6,410) (5,268) 21.7% FX gain/(loss) (385) 252
Underlying EBITDA (i) 11,923 10,834 10.1% Depreciation & amortisation (3,376) (2,552) 32.3% Underlying EBIT (i) 8,547 8,282 3.2% One–off ACCC legal Costs (160)
Reported EBIT 8,387 8,282 1.3% % to Gross Sales Trade spend 27.7% 28.0%
Freight-out & distribution costs 5.4% 6.0%
Marketing costs 2.1% 2.6%
Gross Margin (GSV less Trade Spend & COGS) 24.5% 24.5%