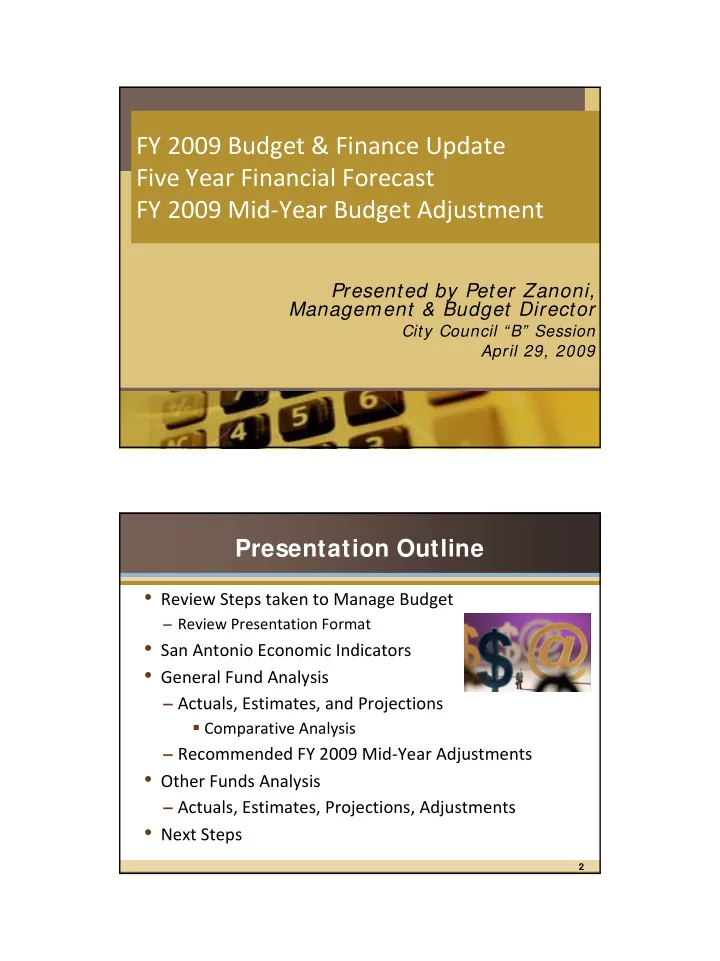
fy 2009 budget finance update five year financial
play

FY 2009 Budget & Finance Update Five Year Financial Forecast FY - PDF document

FY 2009 Budget & Finance Update Five Year Financial Forecast FY 2009 Mid Year Budget Adjustment Presented by Peter Zanoni, Management & Budget Director City Council B Session April 29, 2009 Presentation Outline Review


  1. FY 2009 Budget & Finance Update Five Year Financial Forecast FY 2009 Mid ‐ Year Budget Adjustment Presented by Peter Zanoni, Management & Budget Director City Council “B” Session April 29, 2009 Presentation Outline • Review Steps taken to Manage Budget – Review Presentation Format • San Antonio Economic Indicators • General Fund Analysis – Actuals, Estimates, and Projections � Comparative Analysis – Recommended FY 2009 Mid ‐ Year Adjustments • Other Funds Analysis – Actuals, Estimates, Projections, Adjustments • Next Steps 2

  2. Budget / Finance Condition Summary • FY 2009 Adopted Budget is balanced • FY 2009 Budget remains balanced today and will be balanced on September 30, 2009 • General Fund Revenues are down • Budget / Finance strategy allows budget to remain balanced and generates $25 million for FY 2010 General Fund Budget 3 Proactive Measures to Manage FY 2009 Budget • September – FY 2009 Balanced Budget approved on September 11 – Fiscal Year starts October 1, 2008 and ends September 30, 2009 • November – Early status of FY 2009 Budget provided to City Council � City Manager ’ s Report – Budget Update • January – Weakness is seen in major General Fund revenue sources � “ Hiring Chill ” initiated � Departmental Reduction Contingency Plans Requested � Options to slow FY 2009 Budgeted enhancements reviewed 4

  3. Proactive Measures to Manage FY 2009 Budget • February – 3+9 Budget & Finance Report presented to City Council � Options to Slow Down Spending within FY 2009 General Fund Budget Enhancements presented to City Council – FY 2009 Monthly Financial Report through January provided to City Council � Major Revenues Sources experienced further declines • March – FY 2009 Monthly Financial Report through February provided to City Council � Major Revenue Sources continue to experience further declines 5 Proactive Measures to Manage FY 2009 Budget • March – City Manager ’ s Report – Budget update provided – Hiring Freeze Initiated for non ‐ public safety employees – Revenue Update/Budget Updated during “ B ” Session 6

  4. Budget Strategy Overall Budget / Finance Condition Mid-Year Five-Year 6+6 TEXT Budget Forecast Adjustment 7 FY 2009 6+ 6 Budget, Finance, and Performance Report • Continuation of reporting FY 2009 financial and performance status to City Council • Includes actual revenue and expenditure amounts compared to planned amounts through the Second Quarter of FY 2009 • Projects revenues and expenditures for remaining two quarters of FY 2009 6+6 8

  5. FY 2010-FY 2014 Five Year Financial Forecast • Budgetary planning tool • Early identification of projected ending balances • Provides strategic model to evaluate future impact of budget decisions • Part of service delivery/goal setting strategy for FY 2010 Proposed Budget Five-Year Forecast 9 FY 2009 Mid-Year Budget Adjustments • Adjustment recommendations based on actual activity seen in first six months of fiscal year along with future projections • FY 2009 Mid ‐ Year Budget Adjustment Ordinance considered during tomorrow's April 30 City Council “ A ” Session • Result is Revised FY 2009 Budget – FY 2009 Budget reset Mid-Year – Expenditures brought in ‐ line with Budget available funding to address updated Adjustment revenue projections 10

  6. San Antonio Economic Indicators San Antonio Economy • Employment Growth & Unemployment Rate • Business Cycle Index • Housing Indicators • State Economic Indicator Maps 12

  7. SA Employment Growth Rate 6.0% 5.0% 4.3% 4.0% 3.3% 3.1% 3.0% 2.0% 1.2% 0.9% 1.0% 0.4% 0.0% -0.1% -0.2% -1.0% 2001 2002 2003 2004 2005 2006 2007 2008 13 Unemployment Rate Annual Change in Unemployment Rate: San Antonio / Texas / U.S . 9.5 8.5 8.5% 7.5 6.7% 6.5 6.1% 5.5 4.5 3.5 Mar Mar 2008 2009 San Antonio Texas U.S. Source: Federal Reserve Bank of Dallas, Bureau of Labor Statistics 14

  8. Unemployment Rate March 2008/2009 Unemployment Rate City/Region 2008 2009 Change U.S. 5.1% 8.5% 3.4% Texas 4.6% 6.7% 2.1% Dallas 4.6% 7.2% 2.6% Ft Worth 4.4% 7.0% 2.6% Houston 4.4% 6.8% 2.4% San Antonio 4.2% 6.1% 1.9% Austin 3.9% 6.3% 2.4% Source: Federal Reserve Bank of Dallas 15 Business Cycle I ndex • Business Cycle Index measures key economic indicators in particular region including employment (non ‐ agriculture), unemployment rate, wages and retail sales • Movement in index indicates direction of local economy • Index reflects growth at slower pace for San Antonio and all major metro areas in Texas 16

  9. Business Cycle I ndex Annualized % Change: Sept. to March 2009 2.00% 0.00% -2.00% -4.00% -6.00% San Houston Ft. Worth Dallas Austin Texas Antonio ‐ 4.04 0.77 ‐ 0.33 ‐ 3.30 ‐ 5.15 ‐ 3.62 Source: Federal Reserve Bank of Dallas; Percent change calculated by SABER Institute 17 San Antonio Housing I nventory Annual Average Number of months to clear all existing inventory 9.0 8.2 7.4 8.0 7.0 5.7 5.7 5.6 6.0 5.3 5.3 5.1 5.0 4.6 5.0 4.1 4.0 3.0 2.0 1.0 - 1999 2000 2001 2002 2003 2004 2005 2006 2007 2008 2009* Source: Real Estate Center at Texas A&M University * Year-to-Date through March 31, 2009 18

  10. Texas Cities Housing I nventory Average Number of Months to Clear all Existing Inventory 9 8 San Antonio 7 Dallas 6 Ft. Worth 5 Houston Austin 4 Texas 3 2 2007-Jan Jul 2008-Jan Jul 2009-Jan Mar May Sep Nov Mar May Sep Nov Mar Source: Texas A&M Real Estate Center, SABER Institute 19 Texas City Home Sales Year-over-Year % Change March 2008-March 2009 0% -5% -10% -15% -20% -25% -30% -35% San Austin Dallas Ft. Worth Houston Texas Antonio ‐ 25% ‐ 29% ‐ 23% ‐ 26% ‐ 20% ‐ 22% Source: Real Estate Center at Texas A&M University 20

  11. State Economic I ndicator 21 State Economic I ndicator 22

  12. Budget and Finance Current Status and Forecast Budget / Finance Condition Summary • FY 2009 Adopted Budget is balanced • FY 2009 Budget remains balanced today and will be balanced on September 30, 2009 • General Fund Revenues are down • Budget / Finance strategy allows budget to remain balanced and generates $25 million for FY 2010 General Fund Budget 24

  13. General Fund Revenues FY 2009 General Fund Other Resources Property Tax $193.0 (20.7%) Revenues $245.3 (26.4%) Other Police Expenditures $313.4 $259.7 Parks & Rec. Pub. Works $58.8 Sales Tax Fire $79.2* CPS $218.9 Revenues Revenues $202.8 $288.9 (21.8%) (31.1%) • Public Safety represents 57% of Budget *Includes transfer to Street Maintenance Fund TOTAL: $929,961,935 TOTAL: $929,961,935 26

  14. General Fund Revenue Summary • With 3+9 Budget and Finance Report, General Fund Revenues for FY 2009 were projected to be below planned budget amount by $21 M , or 2.4% – Negative Variance Offset by $21.5 M better beginning balance • Now, with 6+6 Report, General Fund Revenues for FY 2009 are projected to be below planned budget amount by $49 M or 5.5% 27 General Fund Revenue Variance ($ in Millions) 6+6 Revenue Source 3+9 Variance Change Variance CPS Payment ($14.9) ($34.5) ($19.6) Sales Tax $0 ($10.8) ($10.8) Property Tax ($3.4) ($3.1) $ 0.3 Other Revenue ($3.1) ($0.1) $ 3.0 Total ($21) ($49) ($27) 28

  15. General Fund Revenues – All Sources ($ in Millions) $887.50 $838.34 $800 $600 $528.01 $511.23 $400 $200 2Q Planned 2Q Actual Budget Estimate 2Q ‐ Planned 2Q ‐ Actual Unfavorable FY 2009 FY 2009 Unfavorable Amount Amount Variance Budget Estimate Variance All Sources $528,014,008 $511,228,329 ($16,785,679) $887,502,155 $838,341,329 ($49,160,826) 29 6+ 6 Sales Tax Revenue ($ in Millions) $250 $202.81 $191.97 $200 $150 $99.21 $95.85 $100 $50 $- 2Q Planned 2Q Actual Budget Estimate 2Q ‐ Planned 2Q ‐ Actual Unfavorable FY 2009 FY 2009 Unfavorable Amount Amount Variance Budget Estimate Variance Sales Tax $99,208,858 $95,845,841 ($3,363,017) $202,809,519 $191,968,436 ($10,841,083) 30

  16. FY 2009 Sales Tax Monthly Collection ($ in Millions) Month Planned Actual Percent Posted Amount Amount Variance Collected October $17.91 $17.94 $0.03 100.17% November 14.63 15.94 1.31 108.95% December 15.37 14.27 (1.10) 92.84% January 22.29 21.02 (1.27) 94.30% February 14.32 13.35 (0.97) 93.23% March 14.68 13.33 (1.35) 90.80% • 4 Month (Dec. – Mar.) average decrease from Budget Plan: -7.2% • 6+6 Estimate projects monthly continued decline from planned amount by -7.2% • Spring Break Sales Tax Revenues to be received in May 31 Historical Sales Tax Revenues ($ in Millions) $210 $196.3 $192.0 $189.8 $177.8 $162.8 $170 3.5% $148.5 -2.2% 6.7% 9.2% $130 9.6% 6.9% $90 2004 2005 2006 2007 2008 2009 Est. • Ten year average percent growth is 5.2% 32

Download Presentation
Download Policy: The content available on the website is offered to you 'AS IS' for your personal information and use only. It cannot be commercialized, licensed, or distributed on other websites without prior consent from the author. To download a presentation, simply click this link. If you encounter any difficulties during the download process, it's possible that the publisher has removed the file from their server.

Recommend


More recommend