
SLIDE 1
1 1
1
Full Year Results 2014 Continued Underlying Growth Press - - PowerPoint PPT Presentation
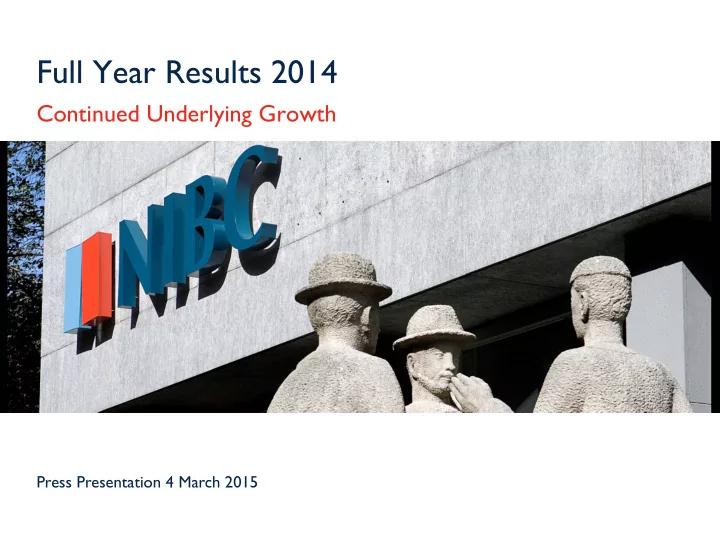
Full Year Results 2014 Continued Underlying Growth Press Presentation 4 March 2015 1 1 1 Highlights Full Year Results 2014 NIBC Bank Paulus de Wilt CEO 4 March 2015 2 2 2 Overall Highlights FY 2014 2014: Continued Underlying Growth
1 1
1
2 2
2
3
4
The Bank for Decisive Moments
Investeringsbank
and consumer banking services through
and London
and co-investment solutions to medium-sized companies and entrepreneurs with a turnover of EUR 50 - 500 million
mortgages, online retail saving deposits and brokerage services via NIBC Direct
decisive moments
Key figures Business Model
2014 2013 2012 Common Equity Tier-1 ratio 15.5%* 18.1% 15.3% Operating income (EUR m) 278 225 272 Net profit (EUR m) 24 22 73 Number of FTEs 637 596 627
*fully loaded Basel III
5 5
5
6
Business performance up substantially
recovery
7
Corporate Lending / M&A
and Germany
Services/Industries & Manufacturing
Development Corporate Loan Portfolio
Market developments Geopolitical tensions Oil price at all-time low
fuel prices
Dollar appreciation against euro
ECB QE – covered bonds and ABS Asset-based Financing Global client sectors:
Renewables The Netherlands and Germany:
LTMV
8
Project Holland Park – Commercial Real Estate
residential area in Diemen-Zuid;
(price range EUR 150 – 250,000);
family offices). Health AG –T echnology, Media & Services Germany
part of a family-owned company;
financing parties may be added at a later stage. Vroon Shipping – Shipping & Intermodal
environment.
9 9
9
10
Leading to a Growing, Loyal Base of Retail Clients
Clients per Geography Mortgage portfolio development Savings Balance NIBC Direct More than 350.000 clients across 3 countries
countries (NIBC Direct Customer Satisfaction Survey, 2014)
competition
mortgage origination level of around EUR 1.0bn and a market share of 2.5% in 2014 (IG&H, 2014)
EUR 7.3bn
> 40,000 clients (1997-2007) > 5,000 clients since 2013 > 170,000 clients since 2008 > 100,000 clients since 2009 > 4,000 clients since 2011 > 35,000 clients since 2012
NIBC offers a range of fair and transparent savings and mortgage products to its retail clients
(EURbn) (EURbn)
11.4 10.5 8.9 8.0 7.4 6.9 7.3
5.0 7.5 10.0 12.5 15.0 2008 2009 2010 2011 2012 2013 2014 White label portfolio NIBC Direct
11
Mortgages
Historical 10-years NHG mortgage rates
Fixed rate period composition of mortgage portfolio
House price development Succesfull return to mortgage market
has offset prepayments of pre-crisis white label portfolio
while the volume of property transactions increased to highest level in single year since 2008 (almost 40% higher compared to 2013)
has been extended with interest only type mortgage loans
been reduced from EUR 290.000 to EUR 265.000, whereas maximum LTMV decreased from 105% to 104% per 1 Jan14
Affordability for homebuyers has improved significantly
price correction and historically low mortgage rates Mortgage loan portfolio is increasing Y-oY Well-seasoned portfolio Late 2014, arrears and defaults (arrears > 3 months) have stabilised
LTMV
60 70 80 90 100 110 CBS 2008 2009 2010 2011 2012 2013 2014 2.0% 2.5% 3.0% 3.5% 4.0% 4.5% 5.0%
NIBC Direct rate
2013 2014 May-2013
5.0 7.5 10.0 12.5 15.0 2008 2009 2010 2011 2012 2013 2014 ≤2 years 3-5 years 6-10 years 11-20 years >20 years
(EURbn)
12
NIBC Direct Savings
…despite sharp decreasing interest rates
Change in composition of deposit terms Composition of clients’ savings balance per country High stickiness of retail savings
products, ranging from on-demand to term deposits up to 10 years
3rd place IPM score in the Netherlands
rate declines in 2014
market
(EURbn)
0.0% 1.0% 2.0% 3.0% 4.0% 5.0% 6.0%
Top Market On-Demand rate NIBC Direct On-Demand rate
2008 2009 2010 2011 2012 2013 2014 0% 25% 50% 75% 100% NL GER BEL ≤25k ≤50k ≤75k ≤100k ≤150k >150k
13 13
13
14
million;
increased origination of both corporate and consumer loans, healthier origination spreads and re-pricing of pre-crisis exposures;
activity, increased origination in corporate loans and a near doubling in investment management fees;
through p&l accounting of certain assets & liabilities and was substantially lower, declining to EUR 3m. We are comfortable with having our net trading income in a narrow range;
assessment of our real estate portfolio.
In EUR millions FY FY H2 H1 H2 H1 2014 2013 2014 2014 2013 2013 Net interest income 231 148 130 100 78 71 Net fee and commission income 27 17 15 12 10 8 Net trading income 3 56 (1) 4 (15) 71 Dividend income 2 2 2 2 Gains less losses from financial assets 16 1 (0) 16 9 (8) Share in result of associates 1 (1) 1 (0) (1) Operating income 278 225 145 134 83 142 Personnel expenses (81) (82) (37) (44) (39) (43) Other operating expenses (52) (48) (27) (25) (24) (23) Depreciation and amortisation (5) (5) (3) (3) (3) (2) Operating expenses (139) (134) (67) (72) (66) (68) Net Operating income 140 90 78 62 17 74 Impairments of financial assets (93) (62) (66) (28) (26) (36) Corporate Tax (4) (6) 2 (6) 4 (11) Underlying net profit before special items 42 22 14 28 (5) 27 Special items SNS Levy (Net) (18)
(12)
24 22 9 15 (5) 27
15
Comments
back of:
Net Interest Income Net Interest Margin
1: As a percentage of corporate loans, residential mortgages and debt investments
(EURm) (bps1)
Client business at better spreads and funding at lower
income improved both quantitatively and qualitatively
16
Development of Operating Expenses
three years, from EUR 170m in 2011 to EUR 139m in 2014
Deutschland AG (“NIBC AG”, formerly Gallinat-Bank AG)
17
31 December 2014 31 December 2013
44% 1% 29% 6% 7% 3% 1% 9% Retail savings Institutional deposits (incl. ESF) Secured (wholesale) funding Unsecured (wholesale) funding State guaranteed Due to Banks Other liabilities Shareholder's equity 45% 6% 28% 1% 7% 3% 1% 9% Retail savings Institutional deposits (incl. ESF) Secured (wholesale) funding TLTRO Unsecured (wholesale) funding Due to Banks Other liabilities Shareholder's equity
18
19 19
19