From Video Analytics to Corrective Measures WA State Pedestrian - - PowerPoint PPT Presentation

from video analytics to corrective measures
SMART_READER_LITE
LIVE PREVIEW

From Video Analytics to Corrective Measures WA State Pedestrian - - PowerPoint PPT Presentation

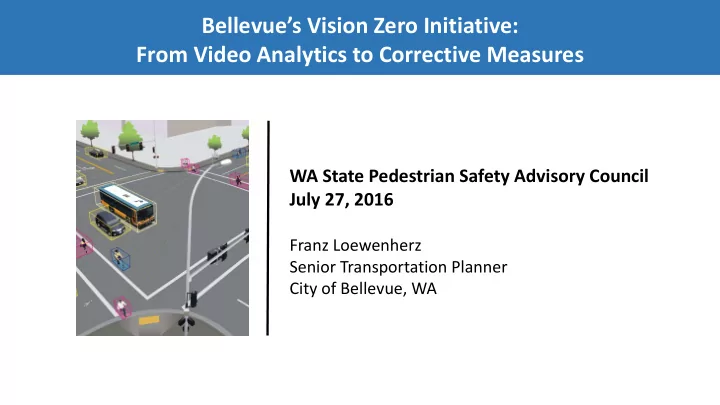
Bellevues Vision Zero Initiative: From Video Analytics to Corrective Measures WA State Pedestrian Safety Advisory Council July 27, 2016 Franz Loewenherz Senior Transportation Planner City of Bellevue, WA Bellevues Vision Zero


slide-1
SLIDE 1

Bellevue’s Vision Zero Initiative: From Video Analytics to Corrective Measures

WA State Pedestrian Safety Advisory Council July 27, 2016

Franz Loewenherz Senior Transportation Planner City of Bellevue, WA

slide-2
SLIDE 2

Bellevue’s Vision Zero Initiative: Why?

2

slide-3
SLIDE 3

Bellevue’s Vision Zero Initiative: Dialogue with the Public

3

Making Vision Zero a reality entails more than just engineering, education, and enforcement. It’s a collaborative effort involving Bellevue residents and businesses.

Amy Carlson, Vice President and Area Office Manager, CH2M HILL

slide-4
SLIDE 4

Vision Zero: Reframing Traffic Deaths & Injuries as Preventable Reactive: Reacting to a problem after it arises. Proactive: Preventing problems before they arise.

4

slide-5
SLIDE 5

Crash-Based Approach: Lakemont Interchange Case Study

From 2005 through 2010 there were 60 collisions recorded by the Bellevue Police Department and the WSP at this location. In 2013, WSDOT built a new roundabout at the intersection of the WB I-90 on- and

  • ff-ramps and WLSP SE/180 Ave SE.

5

slide-6
SLIDE 6

Crash-Based Approach: Short-Comings

  • 1. Crashes are rare events and are therefore associated with the

random variation inherent in small numbers.

  • 2. Not all crashes are reported and the level of reporting is unevenly

distributed with regard to the type of road users involved, location, severity of injuries, etc.

  • 3. The behavioral or situational aspects of the events are not

covered by police crash data.

  • 4. Many years of crash data is typically required to develop an

understanding of the situation.

6

slide-7
SLIDE 7

Hyden’s Safety Pyramid (adapted from Hyden, 1987)

Conflict-Based Approach: Don’t Wait For Crashes to Happen

7

slide-8
SLIDE 8

Conflict-Based Approach: Public Involvement Strategy

Total Points Placed Ped Facilities 514 32% Bike Facilities 573 35% Ped Behaviors 57 4% Bike Behaviors 22 1% Car Behaviors 452 28% Total 1618

8

slide-9
SLIDE 9

Technology Development Partnership

  • Dr. Yinhai Wang

Director PacTrans and STAR Lab

  • Dr. Victor Bahl

Director Mobility & Networking Research Franz Loewenherz Senior Transportation Planner

9

Exploring potential to leverage a city’s existing traffic camera system to simultaneously:

  • monitor counts and travel speed of all

road user groups (vehicle, pedestrian, and bicycle);

  • document the directional volume of all

road user groups as they move through an intersection; and,

  • assess unsafe “near-miss” trajectories and

interactions between all road user groups.

slide-10
SLIDE 10

Milestone 1: Demonstrate the capability of vision technologies by detecting relevant events in the sample traffic videos (e.g., detecting cars, pedestrians, and bikes and tracking their movements). Milestone 2: Demonstrate an end-to-end system that will, continuously in real-time, detect and store the events, and present aggregated information. Milestone 3: Pilot deployment of end-to-end system (running on servers provided by Microsoft) in the City of Bellevue traffic control center. The system will run off of a live feed. Milestone 4: Support additional scenarios (e.g., near-collisions of cars with pedestrians and bikes or patterns of bikers crossing a busy intersection).

Partnership Approach

10

slide-11
SLIDE 11

How A Deep Neural Network Sees

11

slide-12
SLIDE 12

Demo of System

12

slide-13
SLIDE 13

Classified-as Truth Vehicles Bikes Peds None Vehicles

0.95

0.01 0.02 0.02 Bikes 0.08

0.66

0.16 0.08 Peds 0.15 0.15

0.65

0.05 None 0.09 0.03 0.11

0.75

When it really is… We recognized it as…

0.73 0.81 0.67

Object Classification Accuracy

13

slide-14
SLIDE 14

Literature Review: Classifying Near-Miss Events

Time to Collision (Matsui et al., 2013) Post Encroachment Time (Van der Horst et. al., 2014) Swedish Conflict Technique (Hyden et. al., 1987)

14

slide-15
SLIDE 15

Object Detection

15

slide-16
SLIDE 16

Trajectory Detection & Turning Movement Counts

16

slide-17
SLIDE 17

Vehicle Distribution Charts

17

slide-18
SLIDE 18

Near-Miss Detection

18

slide-19
SLIDE 19

Potential Research Questions

8

  • 1. How often are vehicles speeding and failing to yield to pedestrians?
  • 2. How often do pedestrians disregard traffic signals?
  • 3. How often do bicyclists fail to stop at stop signs or run red lights?
  • 4. Are there any identifiable trends that hint at the reasons why certain

laws are broken in certain places?

  • 5. Did a countermeasure have the desired effect?
slide-20
SLIDE 20

Opportunity for USDOT Partnership?

19

  • 1. Take a Complete Streets approach
  • 2. Identify and address barriers to make streets safe and

convenient for all road users, including people of all ages and abilities and those using assistive mobility devices

  • 3. Gather and track biking and walking data
  • 4. Use designs that are appropriate to the context of the

street and its uses

  • 5. Take advantage of opportunities to create and complete

pedestrian and bicycle networks through maintenance

  • 6. Improve walking and biking safety laws and regulations
  • 7. Educate and enforce proper road use behavior by all
slide-21
SLIDE 21

Safer People, Safer Streets: City of Bellevue

20

slide-22
SLIDE 22

Does Bicycle Usage Increase?

21

Source: Portland State University, Lessons from the Green Lanes: Evaluating Protected Bike Lanes, 2014.

slide-23
SLIDE 23

Where: A = Average number of conflicts at the study location per year V = Intersection ADT (total daily approach volume)

Does the Conflict Rate Decrease?

22

slide-24
SLIDE 24

Funding Requirement

23

Virtual Server Storage Avigilon License Groups 360 HD Cameras Camera Installation

~

$260K

slide-25
SLIDE 25

Bellevue’s Vision Zero Initiative: From Video Analytics to Corrective Measures For More Information

Franz Loewenherz Transportation Department floewenherz@bellevuewa.gov 425‐452‐4077

24