SLIDE 1
Fort Myers - Cape Coral MSA Occupational Employment and Wages
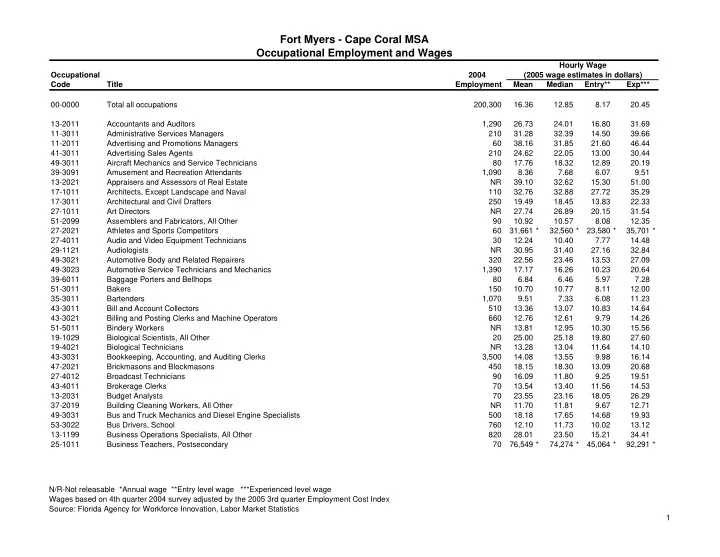
Hourly Wage Occupational 2004 (2005 wage estimates in dollars) Code Title Employment Mean Median Entry** Exp*** 00-0000 Total all occupations 200,300 16.36 12.85 8.17 20.45 13-2011 Accountants and Auditors 1,290 26.73 24.01 16.80 31.69 11-3011 Administrative Services Managers 210 31.28 32.39 14.50 39.66 11-2011 Advertising and Promotions Managers 60 38.16 31.85 21.60 46.44 41-3011 Advertising Sales Agents 210 24.62 22.05 13.00 30.44 49-3011 Aircraft Mechanics and Service Technicians 80 17.76 18.32 12.89 20.19 39-3091 Amusement and Recreation Attendants 1,090 8.36 7.68 6.07 9.51 13-2021 Appraisers and Assessors of Real Estate NR 39.10 32.62 15.30 51.00 17-1011 Architects, Except Landscape and Naval 110 32.76 32.88 27.72 35.29 17-3011 Architectural and Civil Drafters 250 19.49 18.45 13.83 22.33 27-1011 Art Directors NR 27.74 26.89 20.15 31.54 51-2099 Assemblers and Fabricators, All Other 90 10.92 10.57 8.08 12.35 27-2021 Athletes and Sports Competitors 60 31,661 * 32,560 * 23,580 * 35,701 * 27-4011 Audio and Video Equipment Technicians 30 12.24 10.40 7.77 14.48 29-1121 Audiologists NR 30.95 31.40 27.16 32.84 49-3021 Automotive Body and Related Repairers 320 22.56 23.46 13.53 27.09 49-3023 Automotive Service Technicians and Mechanics 1,390 17.17 16.26 10.23 20.64 39-6011 Baggage Porters and Bellhops 80 6.84 6.46 5.97 7.28 51-3011 Bakers 150 10.70 10.77 8.11 12.00 35-3011 Bartenders 1,070 9.51 7.33 6.08 11.23 43-3011 Bill and Account Collectors 510 13.36 13.07 10.83 14.64 43-3021 Billing and Posting Clerks and Machine Operators 660 12.76 12.61 9.79 14.26 51-5011 Bindery Workers NR 13.81 12.95 10.30 15.56 19-1029 Biological Scientists, All Other 20 25.00 25.18 19.80 27.60 19-4021 Biological Technicians NR 13.28 13.04 11.64 14.10 43-3031 Bookkeeping, Accounting, and Auditing Clerks 3,500 14.08 13.55 9.98 16.14 47-2021 Brickmasons and Blockmasons 450 18.15 18.30 13.09 20.68 27-4012 Broadcast Technicians 90 16.09 11.80 9.25 19.51 43-4011 Brokerage Clerks 70 13.54 13.40 11.56 14.53 13-2031 Budget Analysts 70 23.55 23.16 18.05 26.29 37-2019 Building Cleaning Workers, All Other NR 11.70 11.81 9.67 12.71 49-3031 Bus and Truck Mechanics and Diesel Engine Specialists 500 18.18 17.65 14.68 19.93 53-3022 Bus Drivers, School 760 12.10 11.73 10.02 13.12 13-1199 Business Operations Specialists, All Other 820 28.01 23.50 15.21 34.41 25-1011 Business Teachers, Postsecondary 70 76,549 * 74,274 * 45,064 * 92,291 * N/R-Not releasable *Annual wage **Entry level wage ***Experienced level wage Wages based on 4th quarter 2004 survey adjusted by the 2005 3rd quarter Employment Cost Index Source: Florida Agency for Workforce Innovation, Labor Market Statistics 1
SLIDE 2
Fort Myers - Cape Coral MSA Occupational Employment and Wages
Hourly Wage Occupational 2004 (2005 wage estimates in dollars) Code Title Employment Mean Median Entry** Exp*** 51-3021 Butchers and Meat Cutters 220 13.42 13.20 11.41 14.43 51-7011 Cabinetmakers and Bench Carpenters 320 12.55 12.40 9.77 13.93 53-5021 Captains, Mates, and Pilots of Water Vessels 70 23.66 21.14 15.08 27.94 43-5011 Cargo and Freight Agents 40 15.66 14.63 10.88 18.04 47-2031 Carpenters 3,100 15.03 14.68 11.36 16.85 47-2041 Carpet Installers 20 11.84 13.27 6.64 14.44 41-2011 Cashiers 6,540 8.57 8.34 7.00 9.35 47-2051 Cement Masons and Concrete Finishers 1,240 15.18 14.90 10.56 17.49 35-1011 Chefs and Head Cooks 320 20.62 19.41 13.96 23.94 11-1011 Chief Executives 570 72.27 NR 39.82 88.50 39-9011 Child Care Workers 600 8.33 8.15 7.60 8.70 21-1021 Child, Family, and School Social Workers 230 17.88 15.90 12.83 20.41 29-1011 Chiropractors 70 47.13 40.29 31.58 54.92 17-3022 Civil Engineering Technicians 230 20.05 20.21 13.55 23.30 17-2051 Civil Engineers 520 34.86 33.20 26.34 39.11 13-1031 Claims Adjusters, Examiners, and Investigators 260 22.79 21.78 15.66 26.36 53-7061 Cleaners of Vehicles and Equipment 580 9.56 9.30 7.24 10.72 21-2011 Clergy 30 17.38 18.51 12.69 19.73 19-3031 Clinical, Counseling, and School Psychologists NR 81.56 NR NR NR 27-2022 Coaches and Scouts 130 41,570 * 32,992 * 23,459 * 50,624 * 51-9121 Coating, Painting, and Spraying Machine Setters, Operators, and Tenders 30 12.51 12.43 8.86 14.33 49-9091 Coin, Vending, and Amusement Machine Servicers and Repairers NR 12.39 11.59 9.74 13.72 35-3021 Combined Food Preparation and Serving Workers, Including Fast Food 3,870 7.27 6.92 6.04 7.88 53-2012 Commercial Pilots 10 59,078 * 64,137 * 44,421 * 66,407 * 25-1122 Communications Teachers, Postsecondary 10 42,211 * 42,566 * 26,971 * 49,831 * 21-1099 Community and Social Service Specialists, All Other 120 18.23 17.38 13.75 20.47 11-3041 Compensation and Benefits Managers 50 32.34 26.69 18.37 39.34 13-1072 Compensation, Benefits, and Job Analysis Specialists 110 25.56 24.54 16.75 29.96 13-1041 Compliance Officers, Except Agriculture, Construction, Health and Safety, and Transportation 80 18.51 16.73 14.30 20.62 11-3021 Computer and Information Systems Managers 90 37.65 34.75 24.61 44.18 43-9011 Computer Operators 140 17.10 16.93 11.67 19.83 15-1021 Computer Programmers 140 25.49 23.72 18.17 29.13 25-1021 Computer Science Teachers, Postsecondary 40 74,771 * 74,671 * 45,548 * 89,382 * 15-1031 Computer Software Engineers, Applications 110 30.61 28.66 23.26 34.29 15-1032 Computer Software Engineers, Systems Software NR 36.47 36.64 27.03 41.20 15-1099 Computer Specialists, All Other NR 16.89 16.30 11.32 19.67 N/R-Not releasable *Annual wage **Entry level wage ***Experienced level wage Wages based on 4th quarter 2004 survey adjusted by the 2005 3rd quarter Employment Cost Index Source: Florida Agency for Workforce Innovation, Labor Market Statistics 2
SLIDE 3
Fort Myers - Cape Coral MSA Occupational Employment and Wages
Hourly Wage Occupational 2004 (2005 wage estimates in dollars) Code Title Employment Mean Median Entry** Exp*** 15-1041 Computer Support Specialists 500 17.62 16.95 11.87 20.48 15-1051 Computer Systems Analysts 290 27.22 27.04 19.05 31.29 49-2011 Computer, Automated Teller, and Office Machine Repairers 90 15.41 15.68 10.48 17.87 39-6012 Concierges 50 10.06 9.91 7.80 11.19 47-4011 Construction and Building Inspectors 250 20.82 20.62 17.45 22.50 47-4099 Construction and Related Workers, All Other 560 15.84 15.30 11.54 18.00 47-2061 Construction Laborers 2,950 10.50 10.19 7.78 11.86 11-9021 Construction Managers 640 41.72 32.75 24.45 50.37 49-9012 Control and Valve Installers and Repairers, Except Mechanical Door 20 18.11 17.68 13.09 20.60 53-7011 Conveyor Operators and Tenders 50 14.56 13.49 11.70 15.99 35-2019 Cooks, All Other 30 11.18 11.01 9.68 11.93 35-2011 Cooks, Fast Food 580 7.77 7.82 6.51 8.40 35-2012 Cooks, Institution and Cafeteria 280 10.93 11.08 8.85 11.98 35-2014 Cooks, Restaurant 1,410 11.14 10.73 8.70 12.36 35-2015 Cooks, Short Order 310 9.26 9.61 6.90 10.43 13-1051 Cost Estimators 620 23.20 22.50 15.93 26.84 21-1019 Counselors, All Other NR 17.47 16.34 15.63 18.37 41-2021 Counter and Rental Clerks 780 10.62 9.76 6.88 12.49 35-3022 Counter Attendants, Cafeteria, Food Concession, and Coffee Shop 1,550 8.00 7.84 6.24 8.88 43-5021 Couriers and Messengers 210 9.06 8.90 6.41 10.39 23-2091 Court Reporters NR 24.30 24.66 23.42 24.74 43-4031 Court, Municipal, and License Clerks 120 14.03 13.47 11.45 15.31 53-7021 Crane and Tower Operators 60 15.51 15.30 12.33 17.10 13-2041 Credit Analysts 70 36.06 37.91 23.20 42.48 43-4041 Credit Authorizers, Checkers, and Clerks 90 22.70 15.88 11.35 28.38 25-1111 Criminal Justice and Law Enforcement Teachers, Postsecondary 20 66,044 * 59,659 * 49,535 * 74,300 * 43-4051 Customer Service Representatives 3,360 12.82 12.02 9.54 14.46 51-4031 Cutting, Punching, and Press Machine Setters, Operators, and Tenders, Metal and Plastic 60 13.25 12.23 9.62 15.08 43-9021 Data Entry Keyers 480 12.32 11.92 9.39 13.79 15-1061 Database Administrators 110 23.88 23.62 16.94 27.35 41-9011 Demonstrators and Product Promoters 160 13.13 9.65 7.53 15.92 31-9091 Dental Assistants NR 15.78 15.76 13.70 16.82 29-2021 Dental Hygienists 270 31.63 32.48 28.34 33.27 51-9081 Dental Laboratory Technicians 50 16.83 15.86 11.27 19.61 29-1021 Dentists, General 120 69.64 60.21 37.25 85.83 43-9031 Desktop Publishers NR 18.35 15.79 14.86 20.09 N/R-Not releasable *Annual wage **Entry level wage ***Experienced level wage Wages based on 4th quarter 2004 survey adjusted by the 2005 3rd quarter Employment Cost Index Source: Florida Agency for Workforce Innovation, Labor Market Statistics 3
SLIDE 4
Fort Myers - Cape Coral MSA Occupational Employment and Wages
Hourly Wage Occupational 2004 (2005 wage estimates in dollars) Code Title Employment Mean Median Entry** Exp*** 33-3021 Detectives and Criminal Investigators 90 26.96 24.42 18.41 31.24 29-2032 Diagnostic Medical Sonographers 150 26.36 26.30 21.86 28.61 29-2051 Dietetic Technicians 20 11.70 10.93 10.06 12.52 29-1031 Dietitians and Nutritionists 40 21.98 20.73 17.72 24.12 35-9011 Dining Room and Cafeteria Attendants and Bartender Helpers 670 7.36 6.88 6.01 8.03 21-2021 Directors, Religious Activities and Education 30 11.06 10.19 8.40 12.39 35-9021 Dishwashers 980 7.47 7.39 6.06 8.18 43-5032 Dispatchers, Except Police, Fire, and Ambulance 170 14.11 12.88 10.42 15.94 17-3019 Drafters, All Other NR 15.19 15.57 12.90 16.35 51-4032 Drilling and Boring Machine Tool Setters, Operators, and Tenders, Metal and Plastic 30 12.29 12.43 9.02 13.92 53-3031 Driver/Sales Workers 810 13.21 12.72 6.32 16.64 47-2081 Drywall and Ceiling Tile Installers 620 15.92 15.41 11.38 18.20 47-5021 Earth Drillers, Except Oil and Gas 20 13.22 13.24 11.44 14.11 11-9039 Education Administrators, All Other 10 32.84 28.25 25.06 36.73 11-9032 Education Administrators, Elementary and Secondary School 180 72,706 * 73,154 * 62,647 * 77,735 * 11-9033 Education Administrators, Postsecondary 80 32.79 27.29 21.53 38.41 11-9031 Education Administrators, Preschool and Child Care Center/Program 30 15.84 15.93 14.64 16.44 25-9099 Education, Training, and Library Workers, All Other 60 22.11 14.85 11.93 27.21 21-1012 Educational, Vocational, and School Counselors 180 28.30 28.89 17.82 33.54 17-3023 Electrical and Electronic Engineering Technicians 330 18.08 14.79 13.07 20.58 51-2022 Electrical and Electronic Equipment Assemblers 50 12.82 13.93 9.14 14.67 17-3012 Electrical and Electronics Drafters 30 21.84 21.66 18.39 23.56 49-2093 Electrical and Electronics Installers and Repairers, Transportation Equipment 40 15.60 15.50 13.17 16.82 49-2094 Electrical and Electronics Repairers, Commercial and Industrial Equipment NR 18.77 18.86 13.60 21.36 17-2071 Electrical Engineers 40 31.41 31.18 23.36 35.44 49-9051 Electrical Power-Line Installers and Repairers 110 20.75 22.27 14.66 23.80 47-2111 Electricians 1,280 15.29 15.51 11.76 17.06 49-2096 Electronic Equipment Installers and Repairers, Motor Vehicles 10 14.82 13.52 10.76 16.86 49-2097 Electronic Home Entertainment Equipment Installers and Repairers 30 14.49 14.13 11.04 16.23 17-2072 Electronics Engineers, Except Computer 160 31.47 32.81 27.22 33.59 25-2021 Elementary School Teachers, Except Special Education 1,310 55,396 * 54,778 * 41,079 * 62,555 * 13-1061 Emergency Management Specialists 10 25.45 24.83 20.85 27.75 13-1071 Employment, Recruitment, and Placement Specialists 220 20.95 17.35 14.98 23.94 11-9041 Engineering Managers 140 47.13 41.68 30.17 55.61 17-2199 Engineers, All Other 60 20.99 19.28 13.74 24.63 25-1123 English Language and Literature Teachers, Postsecondary 40 50,259 * 48,176 * 31,283 * 59,748 * N/R-Not releasable *Annual wage **Entry level wage ***Experienced level wage Wages based on 4th quarter 2004 survey adjusted by the 2005 3rd quarter Employment Cost Index Source: Florida Agency for Workforce Innovation, Labor Market Statistics 4
SLIDE 5
Fort Myers - Cape Coral MSA Occupational Employment and Wages
Hourly Wage Occupational 2004 (2005 wage estimates in dollars) Code Title Employment Mean Median Entry** Exp*** 27-2099 Entertainers and Performers, Sports and Related Workers, All Other 20 17.87 8.19 5.90 23.87 17-2081 Environmental Engineers 10 27.52 26.03 20.12 31.22 19-4091 Environmental Science and Protection Technicians, Including Health 70 16.27 15.98 13.29 17.76 19-2041 Environmental Scientists and Specialists, Including Health 190 21.75 19.77 15.53 24.86 53-7032 Excavating and Loading Machine and Dragline Operators 130 14.62 14.15 12.03 15.91 43-6011 Executive Secretaries and Administrative Assistants 2,260 15.91 15.42 11.96 17.89 29-1062 Family and General Practitioners 180 90.30 NR NR NR 25-9021 Farm and Home Management Advisors 20 24.96 23.94 17.93 28.47 49-3041 Farm Equipment Mechanics NR 14.16 14.76 11.46 15.51 45-2092 Farmworkers and Laborers, Crop, Nursery, and Greenhouse 150 7.46 7.30 6.11 8.14 51-2091 Fiberglass Laminators and Fabricators 150 12.54 12.41 8.50 14.57 43-4071 File Clerks 740 10.13 9.90 7.99 11.20 27-4032 Film and Video Editors 20 11.64 10.44 7.27 13.82 13-2051 Financial Analysts 70 30.53 25.86 18.30 36.65 11-3031 Financial Managers 330 39.16 35.49 26.19 45.64 13-2099 Financial Specialists, All Other 110 23.14 21.39 14.60 27.41 33-2011 Fire Fighters 730 18.97 19.01 13.38 21.77 33-2021 Fire Inspectors and Investigators 50 25.13 25.43 20.98 27.20 47-1011 First-Line Supervisors/Managers of Construction Trades and Extraction Workers 3,000 20.64 17.98 14.94 23.48 45-1011 First-Line Supervisors/Managers of Farming, Fishing, and Forestry Workers 20 13.59 15.27 8.27 16.25 33-1021 First-Line Supervisors/Managers of Fire Fighting and Prevention Workers 110 29.75 29.97 20.36 34.45 35-1012 First-Line Supervisors/Managers of Food Preparation and Serving Workers 980 16.26 16.16 11.47 18.66 53-1021 First-Line Supervisors/Managers of Helpers, Laborers, and Material Movers, Hand 90 16.38 15.82 10.78 19.17 37-1011 First-Line Supervisors/Managers of Housekeeping and Janitorial Workers 320 15.02 15.13 10.28 17.39 37-1012 First-Line Supervisors/Managers of Landscaping, Lawn Service, and Groundskeeping Workers 310 19.22 17.94 13.59 22.03 49-1011 First-Line Supervisors/Managers of Mechanics, Installers, and Repairers 720 25.86 22.35 16.44 30.56 41-1012 First-Line Supervisors/Managers of Non-Retail Sales Workers 560 35.25 26.96 18.13 43.82 43-1011 First-Line Supervisors/Managers of Office and Administrative Support Workers 1,940 20.41 18.68 13.40 23.90 39-1021 First-Line Supervisors/Managers of Personal Service Workers 290 21.76 23.10 14.84 25.22 33-1012 First-Line Supervisors/Managers of Police and Detectives 80 35.03 35.57 26.76 39.17 51-1011 First-Line Supervisors/Managers of Production and Operating Workers 610 23.06 21.33 14.13 27.52 41-1011 First-Line Supervisors/Managers of Retail Sales Workers 1,940 23.44 17.51 12.15 29.09 53-1031 First-Line Supervisors/Managers of Transportation and Material-Moving Machine and Vehicle 280 23.37 21.44 15.63 27.25 33-1099 First-Line Supervisors/Managers, Protective Service Workers, All Other 50 17.35 15.06 10.39 20.83 39-9031 Fitness Trainers and Aerobics Instructors 200 13.19 11.52 8.00 15.78 27-1023 Floral Designers 130 10.68 10.56 8.09 11.96 N/R-Not releasable *Annual wage **Entry level wage ***Experienced level wage Wages based on 4th quarter 2004 survey adjusted by the 2005 3rd quarter Employment Cost Index Source: Florida Agency for Workforce Innovation, Labor Market Statistics 5
SLIDE 6
Fort Myers - Cape Coral MSA Occupational Employment and Wages
Hourly Wage Occupational 2004 (2005 wage estimates in dollars) Code Title Employment Mean Median Entry** Exp*** 35-9099 Food Preparation and Serving Related Workers, All Other 70 9.72 8.45 6.97 11.11 35-2021 Food Preparation Workers 1,190 9.63 9.51 7.47 10.72 35-3041 Food Servers, Nonrestaurant 770 7.70 6.97 6.10 8.51 11-9051 Food Service Managers 390 23.19 23.14 13.66 27.95 19-4092 Forensic Science Technicians 40 19.85 19.58 14.17 22.68 11-9061 Funeral Directors 20 30.06 23.26 19.96 35.12 51-7021 Furniture Finishers 20 16.87 16.26 14.49 18.05 39-1011 Gaming Supervisors 10 31.01 25.24 20.78 36.14 11-1021 General and Operations Managers 1,870 45.63 38.07 23.58 56.66 47-2121 Glaziers 180 14.56 14.85 12.04 15.81 27-1024 Graphic Designers 220 17.29 15.48 11.42 20.23 51-9022 Grinding and Polishing Workers, Hand 40 13.10 13.17 9.40 14.95 37-3019 Grounds Maintenance Workers, All Other NR 9.99 10.06 8.75 10.61 39-5012 Hairdressers, Hairstylists, and Cosmetologists 730 12.99 11.54 7.77 15.59 29-1199 Health Diagnosing and Treating Practitioners, All Other 200 27.31 28.63 19.50 31.20 21-1091 Health Educators 80 17.06 16.08 9.47 20.85 25-1071 Health Specialties Teachers, Postsecondary 70 54,053 * 54,986 * 34,754 * 63,704 * 29-2099 Health Technologists and Technicians, All Other 160 15.21 13.73 11.47 17.08 29-9099 Healthcare Practitioners and Technical Workers, All Other NR 30.04 36.14 14.03 38.04 31-9099 Healthcare Support Workers, All Other 220 12.29 11.76 9.44 13.71 49-9021 Heating, Air Conditioning, and Refrigeration Mechanics and Installers 1,080 16.22 16.05 11.22 18.71 47-3019 Helpers, Construction Trades, All Other NR 10.92 11.88 7.96 12.41 47-3011 Helpers--Brickmasons, Blockmasons, Stonemasons, and Tile and Marble Setters NR 11.24 10.90 9.48 12.12 47-3012 Helpers--Carpenters 380 10.39 10.51 9.15 11.01 47-3013 Helpers--Electricians 370 10.51 10.34 9.63 10.94 49-9098 Helpers--Installation, Maintenance, and Repair Workers 230 9.75 9.18 7.79 10.72 47-3014 Helpers--Painters, Paperhangers, Plasterers, and Stucco Masons NR 11.28 11.50 8.95 12.44 47-3015 Helpers--Pipelayers, Plumbers, Pipefitters, and Steamfitters 170 11.92 10.73 9.43 13.17 51-9198 Helpers--Production Workers 180 9.03 9.01 7.02 10.04 47-4051 Highway Maintenance Workers 50 13.79 13.42 10.71 15.32 49-9031 Home Appliance Repairers 60 13.86 14.17 9.87 15.86 31-1011 Home Health Aides 730 10.29 10.17 8.32 11.29 35-9031 Hosts and Hostesses, Restaurant, Lounge, and Coffee Shop 700 7.78 7.59 6.04 8.66 43-4081 Hotel, Motel, and Resort Desk Clerks 450 9.86 9.84 8.52 10.52 43-4161 Human Resources Assistants, Except Payroll and Timekeeping 170 14.86 14.50 10.59 17.00 11-3049 Human Resources Managers, All Other 20 42.35 38.88 28.73 49.16 N/R-Not releasable *Annual wage **Entry level wage ***Experienced level wage Wages based on 4th quarter 2004 survey adjusted by the 2005 3rd quarter Employment Cost Index Source: Florida Agency for Workforce Innovation, Labor Market Statistics 6
SLIDE 7
Fort Myers - Cape Coral MSA Occupational Employment and Wages
Hourly Wage Occupational 2004 (2005 wage estimates in dollars) Code Title Employment Mean Median Entry** Exp*** 13-1079 Human Resources, Training, and Labor Relations Specialists, All Other 160 23.72 22.24 16.47 27.34 17-3026 Industrial Engineering Technicians 40 17.33 15.94 12.42 19.79 17-2112 Industrial Engineers 80 23.42 21.49 17.35 26.44 49-9041 Industrial Machinery Mechanics 50 16.35 15.40 13.11 17.97 11-3051 Industrial Production Managers 50 38.04 31.05 20.35 46.88 53-7051 Industrial Truck and Tractor Operators 530 12.28 11.33 9.65 13.60 43-4199 Information and Record Clerks, All Other 380 14.81 13.58 10.59 16.91 51-9061 Inspectors, Testers, Sorters, Samplers, and Weighers 340 16.38 15.43 11.42 18.86 49-9099 Installation, Maintenance, and Repair Workers, All Other 310 15.58 14.44 11.09 17.82 25-9031 Instructional Coordinators 40 29.35 30.79 19.71 34.17 47-2131 Insulation Workers, Floor, Ceiling, and Wall 170 16.64 17.97 11.35 19.29 47-2132 Insulation Workers, Mechanical NR 14.47 14.58 12.36 15.52 43-9041 Insurance Claims and Policy Processing Clerks 240 14.99 14.16 12.16 16.41 41-3021 Insurance Sales Agents 650 21.16 19.30 13.88 24.81 27-1025 Interior Designers 310 25.34 21.46 13.39 31.32 29-1063 Internists, General 60 89.75 NR NR NR 27-3091 Interpreters and Translators 20 15.98 16.43 11.22 18.36 37-2011 Janitors and Cleaners, Except Maids and Housekeeping Cleaners 2,430 10.92 9.59 7.38 12.70 51-9071 Jewelers and Precious Stone and Metal Workers NR 15.80 17.96 10.13 18.64 25-2012 Kindergarten Teachers, Except Special Education 230 55,544 * 55,143 * 41,641 * 62,496 * 53-7062 Laborers and Freight, Stock, and Material Movers, Hand 1,810 9.42 9.04 7.25 10.51 17-1012 Landscape Architects 20 24.05 23.50 16.89 27.64 37-3011 Landscaping and Groundskeeping Workers 3,290 10.36 9.87 7.48 11.80 51-6011 Laundry and Dry-Cleaning Workers 450 9.03 8.59 6.98 10.05 23-1011 Lawyers 700 41.65 30.78 19.29 52.83 43-6012 Legal Secretaries 290 15.83 16.06 12.82 17.33 23-2099 Legal Support Workers, All Other 40 20.80 20.43 17.13 22.63 11-1031 Legislators 40 16.86 13.12 12.34 19.12 25-4021 Librarians 190 25.52 24.39 17.89 29.34 29-2061 Licensed Practical and Licensed Vocational Nurses 910 17.01 16.99 14.92 18.06 19-4099 Life, Physical, and Social Science Technicians, All Other 90 14.94 14.24 12.59 16.12 33-9092 Lifeguards, Ski Patrol, and Other Recreational Protective Service Workers 30 11.76 11.12 9.38 12.95 13-2071 Loan Counselors NR 18.80 18.85 16.39 20.00 43-4131 Loan Interviewers and Clerks 370 14.47 14.19 9.99 16.72 13-2072 Loan Officers 580 27.78 20.84 15.54 33.89 39-3093 Locker Room, Coatroom, and Dressing Room Attendants 30 9.89 9.64 7.88 10.89 N/R-Not releasable *Annual wage **Entry level wage ***Experienced level wage Wages based on 4th quarter 2004 survey adjusted by the 2005 3rd quarter Employment Cost Index Source: Florida Agency for Workforce Innovation, Labor Market Statistics 7
SLIDE 8
Fort Myers - Cape Coral MSA Occupational Employment and Wages
Hourly Wage Occupational 2004 (2005 wage estimates in dollars) Code Title Employment Mean Median Entry** Exp*** 49-9094 Locksmiths and Safe Repairers 40 15.41 13.92 9.37 18.44 11-9081 Lodging Managers 100 30.32 24.45 18.27 36.34 13-1081 Logisticians 20 28.37 25.70 18.35 33.37 51-4041 Machinists 140 14.61 14.46 10.69 16.57 37-2012 Maids and Housekeeping Cleaners 1,670 8.74 8.41 7.29 9.46 43-9051 Mail Clerks and Mail Machine Operators, Except Postal Service 100 11.19 11.10 7.93 12.82 49-9042 Maintenance and Repair Workers, General 2,250 14.08 13.11 9.73 16.25 49-9043 Maintenance Workers, Machinery 130 14.81 14.69 12.04 16.20 13-1111 Management Analysts 400 29.70 25.09 17.71 35.69 11-9199 Managers, All Other 310 35.11 33.51 20.66 42.34 39-5092 Manicurists and Pedicurists 80 9.60 8.94 6.57 11.12 19-3021 Market Research Analysts 150 24.16 22.44 16.43 28.03 11-2021 Marketing Managers 130 38.09 34.60 23.08 45.60 31-9011 Massage Therapists 50 10.99 11.41 6.22 13.36 53-7199 Material Moving Workers, All Other NR 8.97 8.21 6.84 10.04 25-1022 Mathematical Science Teachers, Postsecondary 40 54,553 * 52,488 * 37,598 * 63,030 * 51-3022 Meat, Poultry, and Fish Cutters and Trimmers 70 12.26 12.04 9.87 13.46 17-3013 Mechanical Drafters 150 21.52 21.60 13.35 25.61 17-3027 Mechanical Engineering Technicians NR 20.44 20.40 15.83 22.76 17-2141 Mechanical Engineers 90 30.05 28.01 20.95 34.61 29-2012 Medical and Clinical Laboratory Technicians 60 14.51 14.23 11.09 16.22 11-9111 Medical and Health Services Managers 260 43.98 35.65 25.98 52.98 21-1022 Medical and Public Health Social Workers 130 20.92 19.55 14.31 24.22 31-9092 Medical Assistants 910 11.92 12.09 10.05 12.85 49-9062 Medical Equipment Repairers 20 16.78 14.66 11.52 19.40 29-2071 Medical Records and Health Information Technicians 340 15.45 13.46 10.25 18.05 19-1042 Medical Scientists, Except Epidemiologists NR 27.83 26.36 21.23 31.13 43-6013 Medical Secretaries NR 12.54 12.58 10.45 13.58 31-9094 Medical Transcriptionists 100 12.82 13.91 8.07 15.20 13-1121 Meeting and Convention Planners 20 20.49 19.56 12.84 24.33 21-1023 Mental Health and Substance Abuse Social Workers 50 18.78 17.55 14.13 21.11 21-1014 Mental Health Counselors 110 17.72 17.07 12.98 20.09 27-1026 Merchandise Displayers and Window Trimmers 120 12.20 11.36 8.02 14.29 43-5041 Meter Readers, Utilities NR 13.50 13.03 11.40 14.55 25-2022 Middle School Teachers, Except Special and Vocational Education 650 56,285 * 55,137 * 42,093 * 63,381 * 49-3042 Mobile Heavy Equipment Mechanics, Except Engines 240 18.12 17.75 13.38 20.48 N/R-Not releasable *Annual wage **Entry level wage ***Experienced level wage Wages based on 4th quarter 2004 survey adjusted by the 2005 3rd quarter Employment Cost Index Source: Florida Agency for Workforce Innovation, Labor Market Statistics 8
SLIDE 9
Fort Myers - Cape Coral MSA Occupational Employment and Wages
Hourly Wage Occupational 2004 (2005 wage estimates in dollars) Code Title Employment Mean Median Entry** Exp*** 51-9195 Molders, Shapers, and Casters, Except Metal and Plastic NR 14.84 13.58 9.23 17.65 51-4072 Molding, Coremaking, and Casting Machine Setters, Operators, and Tenders, Metal and Plastic 50 11.13 11.04 7.82 12.79 39-3021 Motion Picture Projectionists 20 7.98 6.62 6.05 8.94 53-3099 Motor Vehicle Operators, All Other 320 7.24 7.39 6.14 7.80 49-3051 Motorboat Mechanics 210 15.62 15.41 11.87 17.49 53-5022 Motorboat Operators 20 13.94 11.96 10.09 15.87 51-4081 Multiple Machine Tool Setters, Operators, and Tenders, Metal and Plastic 10 14.32 14.67 11.20 15.89 27-2041 Music Directors and Composers 20 29.92 21.01 13.87 37.95 27-2042 Musicians and Singers NR 25.57 24.27 13.77 31.47 11-9121 Natural Sciences Managers 20 46.84 36.60 21.84 59.34 15-1071 Network and Computer Systems Administrators 160 26.81 25.81 19.43 30.49 15-1081 Network Systems and Data Communications Analysts 180 22.69 21.41 14.90 26.59 43-4141 New Accounts Clerks 200 13.75 13.67 9.88 15.70 39-2021 Nonfarm Animal Caretakers 240 9.00 8.71 7.44 9.79 31-1012 Nursing Aides, Orderlies, and Attendants 2,000 10.61 10.55 9.04 11.39 29-9011 Occupational Health and Safety Specialists 10 21.57 20.48 15.86 24.43 29-1122 Occupational Therapists 170 29.14 29.41 21.03 33.20 43-9199 Office and Administrative Support Workers, All Other 40 12.38 12.38 9.60 13.78 43-9061 Office Clerks, General 4,820 11.53 11.02 8.23 13.18 43-9071 Office Machine Operators, Except Computer 110 11.22 10.64 9.15 12.26 47-2073 Operating Engineers and Other Construction Equipment Operators 940 14.71 14.30 11.87 16.14 15-2031 Operations Research Analysts 70 21.73 20.75 14.44 25.36 51-9083 Ophthalmic Laboratory Technicians NR 12.95 11.49 8.53 15.17 29-2081 Opticians, Dispensing 150 16.22 16.69 12.29 18.18 29-1041 Optometrists 60 34.99 27.48 24.50 40.25 43-4151 Order Clerks 420 12.25 11.66 8.89 13.93 49-3053 Outdoor Power Equipment and Other Small Engine Mechanics 50 19.38 19.77 13.08 22.53 51-9111 Packaging and Filling Machine Operators and Tenders 270 10.04 9.66 7.65 11.23 53-7064 Packers and Packagers, Hand NR 7.17 6.94 6.02 7.74 47-2141 Painters, Construction and Maintenance 920 14.05 13.19 11.10 15.51 51-9122 Painters, Transportation Equipment 70 16.95 14.97 10.59 20.13 51-9123 Painting, Coating, and Decorating Workers 40 10.90 10.68 9.65 11.53 47-2142 Paperhangers 70 14.55 13.68 12.10 15.77 23-2011 Paralegals and Legal Assistants 270 17.52 16.88 14.28 19.14 53-6021 Parking Lot Attendants 250 6.76 6.56 6.08 7.09 41-2022 Parts Salespersons 310 16.50 15.00 12.09 18.70 N/R-Not releasable *Annual wage **Entry level wage ***Experienced level wage Wages based on 4th quarter 2004 survey adjusted by the 2005 3rd quarter Employment Cost Index Source: Florida Agency for Workforce Innovation, Labor Market Statistics 9
SLIDE 10
Fort Myers - Cape Coral MSA Occupational Employment and Wages
Hourly Wage Occupational 2004 (2005 wage estimates in dollars) Code Title Employment Mean Median Entry** Exp*** 47-2071 Paving, Surfacing, and Tamping Equipment Operators 80 15.18 13.94 11.16 17.19 43-3051 Payroll and Timekeeping Clerks 270 13.92 13.32 10.37 15.70 39-9021 Personal and Home Care Aides 690 10.82 10.39 9.74 11.36 39-9099 Personal Care and Service Workers, All Other 150 8.63 6.90 5.98 9.95 13-2052 Personal Financial Advisors 130 37.68 27.79 16.30 48.37 37-2021 Pest Control Workers 430 12.39 11.90 8.77 14.21 37-3012 Pesticide Handlers, Sprayers, and Applicators, Vegetation NR 12.33 11.75 8.61 14.20 29-1051 Pharmacists 420 43.12 43.76 37.73 45.81 31-9095 Pharmacy Aides NR 10.39 10.25 8.07 11.54 29-2052 Pharmacy Technicians 470 11.03 10.75 8.63 12.23 25-1126 Philosophy and Religion Teachers, Postsecondary 10 44,647 * 48,080 * 32,263 * 50,838 * 27-4021 Photographers 50 13.23 12.67 9.29 15.18 51-9132 Photographic Processing Machine Operators 100 9.65 9.59 7.75 10.60 31-2022 Physical Therapist Aides 60 10.10 9.86 6.73 11.79 31-2021 Physical Therapist Assistants 100 22.24 21.31 17.97 24.38 29-1123 Physical Therapists 260 35.93 32.52 26.79 40.51 29-1071 Physician Assistants 40 37.85 36.22 32.44 40.55 29-1069 Physicians and Surgeons, All Other NR 87.06 NR NR NR 47-2151 Pipelayers 180 12.57 12.20 10.42 13.64 51-8099 Plant and System Operators, All Other NR 19.00 19.23 14.91 21.04 47-2161 Plasterers and Stucco Masons 170 17.26 17.11 14.17 18.81 47-2152 Plumbers, Pipefitters, and Steamfitters 800 16.76 16.60 12.34 18.97 33-3051 Police and Sheriff's Patrol Officers 1,000 20.81 20.30 16.20 23.13 43-5031 Police, Fire, and Ambulance Dispatchers 180 15.13 14.04 12.02 16.68 43-5051 Postal Service Clerks 150 22.68 23.70 18.55 24.74 43-5052 Postal Service Mail Carriers 630 21.40 22.38 16.18 24.01 43-5053 Postal Service Mail Sorters, Processors, and Processing Machine Operators 470 20.32 21.17 15.07 22.94 11-9131 Postmasters and Mail Superintendents 10 31.50 31.41 25.82 34.35 25-1199 Postsecondary Teachers, All Other 230 39,840 * 36,346 * 20,889 * 49,314 * 51-5022 Prepress Technicians and Workers 50 14.91 15.42 10.03 17.36 25-2011 Preschool Teachers, Except Special Education 420 10.66 9.03 7.48 12.25 51-6021 Pressers, Textile, Garment, and Related Materials 90 8.53 8.35 7.38 9.10 51-5023 Printing Machine Operators 160 14.51 13.96 11.24 16.14 33-9021 Private Detectives and Investigators 160 9.65 7.51 6.13 11.42 27-2012 Producers and Directors 70 31.41 27.48 17.48 38.37 51-9199 Production Workers, All Other 20 7.67 6.79 6.03 8.49 N/R-Not releasable *Annual wage **Entry level wage ***Experienced level wage Wages based on 4th quarter 2004 survey adjusted by the 2005 3rd quarter Employment Cost Index Source: Florida Agency for Workforce Innovation, Labor Market Statistics 10
SLIDE 11
Fort Myers - Cape Coral MSA Occupational Employment and Wages
Hourly Wage Occupational 2004 (2005 wage estimates in dollars) Code Title Employment Mean Median Entry** Exp*** 43-5061 Production, Planning, and Expediting Clerks 230 17.77 17.37 12.78 20.25 11-9141 Property, Real Estate, and Community Association Managers 650 24.51 23.43 16.25 28.64 33-9099 Protective Service Workers, All Other 480 13.77 12.89 11.59 14.87 29-2053 Psychiatric Technicians 120 13.52 12.78 10.38 15.09 11-2031 Public Relations Managers 40 42.79 34.39 21.07 53.65 27-3031 Public Relations Specialists 270 22.58 21.95 16.00 25.86 13-1023 Purchasing Agents, Except Wholesale, Retail, and Farm Products 290 19.55 18.25 13.11 22.76 11-3061 Purchasing Managers NR 23.35 18.00 16.84 26.60 27-3011 Radio and Television Announcers 90 15.03 12.30 7.53 18.78 29-2034 Radiologic Technologists and Technicians NR 22.26 23.05 16.88 24.95 41-9022 Real Estate Sales Agents 680 30.66 19.69 12.28 39.86 43-4171 Receptionists and Information Clerks 2,110 10.95 10.96 8.50 12.17 39-9032 Recreation Workers 450 12.31 11.21 8.10 14.41 29-1125 Recreational Therapists 20 17.95 17.08 14.49 19.68 53-7081 Refuse and Recyclable Material Collectors 190 13.68 14.52 10.27 15.39 29-1111 Registered Nurses 3,200 25.44 25.08 20.97 27.68 21-1015 Rehabilitation Counselors 160 11.95 10.99 8.95 13.46 47-2171 Reinforcing Iron and Rebar Workers 30 12.43 12.60 10.28 13.52 27-3022 Reporters and Correspondents 120 21.20 18.20 12.20 25.69 43-4181 Reservation and Transportation Ticket Agents and Travel Clerks 370 16.39 13.44 10.08 19.54 39-9041 Residential Advisors 20 17.88 18.64 12.31 20.67 29-1126 Respiratory Therapists 230 19.97 20.13 18.35 20.78 41-2031 Retail Salespersons 9,420 13.25 10.83 7.71 16.02 51-4023 Rolling Machine Setters, Operators, and Tenders, Metal and Plastic 20 14.01 12.69 9.43 16.29 47-2181 Roofers 460 13.69 13.75 10.17 15.45 41-9099 Sales and Related Workers, All Other 330 22.81 17.74 10.03 29.20 41-9031 Sales Engineers 50 40.00 33.07 17.83 51.08 11-2022 Sales Managers 330 44.79 34.88 18.98 57.71 41-3099 Sales Representatives, Services, All Other 600 22.19 17.77 11.28 27.65 41-4012 Sales Representatives, Wholesale and Manufacturing, Except Technical and Scientific Products 2,380 24.36 19.59 12.55 30.26 41-4011 Sales Representatives, Wholesale and Manufacturing, Technical and Scientific Products 400 28.52 21.87 11.82 36.86 51-7041 Sawing Machine Setters, Operators, and Tenders, Wood 40 12.65 12.69 10.99 13.49 43-6014 Secretaries, Except Legal, Medical, and Executive 2,780 12.47 12.26 9.02 14.19 41-3031 Securities, Commodities, and Financial Services Sales Agents 270 47.36 37.10 13.18 64.45 49-2098 Security and Fire Alarm Systems Installers NR 16.78 16.95 11.58 19.37 33-9032 Security Guards 1,820 9.50 9.33 7.13 10.68 N/R-Not releasable *Annual wage **Entry level wage ***Experienced level wage Wages based on 4th quarter 2004 survey adjusted by the 2005 3rd quarter Employment Cost Index Source: Florida Agency for Workforce Innovation, Labor Market Statistics 11
SLIDE 12
Fort Myers - Cape Coral MSA Occupational Employment and Wages
Hourly Wage Occupational 2004 (2005 wage estimates in dollars) Code Title Employment Mean Median Entry** Exp*** 25-3021 Self-Enrichment Education Teachers 260 17.61 16.65 12.62 20.11 47-4071 Septic Tank Servicers and Sewer Pipe Cleaners NR 16.14 15.46 10.06 19.18 53-6031 Service Station Attendants NR 11.18 9.64 7.81 12.87 51-6031 Sewing Machine Operators 110 10.00 9.69 7.56 11.22 39-5093 Shampooers 60 7.39 7.66 6.45 7.86 47-2211 Sheet Metal Workers 460 15.98 16.02 13.03 17.46 43-5071 Shipping, Receiving, and Traffic Clerks 700 11.95 11.50 8.90 13.47 39-5094 Skin Care Specialists 40 11.03 9.38 6.12 13.47 11-9151 Social and Community Service Managers 60 26.36 24.30 17.70 30.70 21-1093 Social and Human Service Assistants 230 12.83 12.70 9.97 14.26 19-4061 Social Science Research Assistants NR 11.21 10.81 10.47 11.58 19-3099 Social Scientists and Related Workers, All Other 10 27.99 30.53 19.18 32.40 21-1029 Social Workers, All Other 20 21.18 20.15 15.12 24.21 29-1127 Speech-Language Pathologists 120 32.41 31.80 26.17 35.52 43-5081 Stock Clerks and Order Fillers 3,930 9.50 9.24 7.24 10.64 47-2221 Structural Iron and Steel Workers NR 14.18 14.86 10.47 16.05 51-2041 Structural Metal Fabricators and Fitters 100 13.77 13.81 9.73 15.78 21-1011 Substance Abuse and Behavioral Disorder Counselors 90 18.05 13.78 11.00 21.57 29-1067 Surgeons NR 93.47 NR NR NR 29-2055 Surgical Technologists 310 18.31 16.98 15.51 19.72 17-3031 Surveying and Mapping Technicians 360 14.21 13.22 9.19 16.72 17-1022 Surveyors 130 25.05 23.71 15.61 29.77 43-2011 Switchboard Operators, Including Answering Service 290 10.47 10.23 8.23 11.59 51-6052 Tailors, Dressmakers, and Custom Sewers 80 10.55 7.75 5.91 12.86 47-2082 Tapers NR 17.60 19.30 12.95 19.91 13-2081 Tax Examiners, Collectors, and Revenue Agents 130 21.08 17.17 12.55 25.35 13-2082 Tax Preparers 100 14.62 11.97 9.99 16.92 53-3041 Taxi Drivers and Chauffeurs 120 9.96 10.00 7.41 11.24 25-9041 Teacher Assistants 1,040 21,902 * 21,489 * 17,482 * 24,112 * 25-3099 Teachers and Instructors, All Other 790 15.50 10.77 9.41 18.55 51-2092 Team Assemblers 850 10.70 10.40 7.96 12.06 27-3042 Technical Writers 30 17.21 17.17 14.47 18.59 49-9052 Telecommunications Line Installers and Repairers 230 13.67 12.75 10.33 15.33 41-9041 Telemarketers 310 9.84 8.70 7.15 11.17 43-3071 Tellers 820 10.93 10.55 9.21 11.78 29-1129 Therapists, All Other 20 21.49 19.44 12.64 25.91 N/R-Not releasable *Annual wage **Entry level wage ***Experienced level wage Wages based on 4th quarter 2004 survey adjusted by the 2005 3rd quarter Employment Cost Index Source: Florida Agency for Workforce Innovation, Labor Market Statistics 12
SLIDE 13 Fort Myers - Cape Coral MSA Occupational Employment and Wages
Hourly Wage Occupational 2004 (2005 wage estimates in dollars) Code Title Employment Mean Median Entry** Exp*** 47-2044 Tile and Marble Setters NR 15.20 14.20 11.29 17.15 49-3093 Tire Repairers and Changers 80 10.62 10.48 8.17 11.84 23-2093 Title Examiners, Abstractors, and Searchers NR 19.33 17.77 15.68 21.16 51-4111 Tool and Die Makers 10 18.34 19.08 14.03 20.50 11-3042 Training and Development Managers 10 31.12 31.96 17.29 38.04 13-1073 Training and Development Specialists 240 20.39 18.43 14.97 23.10 39-6032 Transportation Attendants, Except Flight Attendants and Baggage Porters 240 9.89 9.62 7.86 10.90 53-6099 Transportation Workers, All Other 60 9.49 8.99 7.13 10.67 11-3071 Transportation, Storage, and Distribution Managers 60 39.74 40.46 27.12 46.04 41-3041 Travel Agents 110 14.10 13.02 11.42 15.44 37-3013 Tree Trimmers and Pruners NR 12.86 13.11 12.16 13.22 53-3032 Truck Drivers, Heavy and Tractor-Trailer 1,630 14.71 13.99 11.19 16.47 53-3033 Truck Drivers, Light or Delivery Services 1,940 12.17 10.89 8.20 14.16 51-6093 Upholsterers NR 14.27 14.06 12.26 15.27 19-3051 Urban and Regional Planners 150 26.21 25.23 20.03 29.31 29-1131 Veterinarians 80 42.97 34.01 28.93 50.00 31-9096 Veterinary Assistants and Laboratory Animal Caretakers 110 9.94 9.98 8.26 10.77 29-2056 Veterinary Technologists and Technicians 100 11.54 10.74 9.73 12.43 25-1194 Vocational Education Teachers, Postsecondary 70 18.76 20.16 10.19 23.05 35-3031 Waiters and Waitresses 5,690 7.27 6.45 6.05 7.88 51-8031 Water and Liquid Waste Treatment Plant and System Operators 230 17.24 17.35 13.46 19.13 51-4121 Welders, Cutters, Solderers, and Brazers 280 14.75 14.77 12.15 16.04 51-4122 Welding, Soldering, and Brazing Machine Setters, Operators, and Tenders NR 11.56 9.76 7.95 13.38 13-1022 Wholesale and Retail Buyers, Except Farm Products 190 29.50 20.47 15.07 36.72 51-7099 Woodworkers, All Other 30 9.85 9.81 8.22 10.67 51-7042 Woodworking Machine Setters, Operators, and Tenders, Except Sawing 120 12.16 12.22 10.30 13.10 43-9022 Word Processors and Typists 350 11.45 10.99 8.66 12.83 ** Entry Wage - This is the wage an entry-level worker might expect to make. It is defined as the average (mean) wage earned by the lowest third of all workers in a given occupation. *** Experienced Wage - This wage represents what an experienced worker might expect to make. It is defined as the average (mean) wage earned by the upper two-thirds of all workers in a given
N/R-Not releasable *Annual wage **Entry level wage ***Experienced level wage Wages based on 4th quarter 2004 survey adjusted by the 2005 3rd quarter Employment Cost Index Source: Florida Agency for Workforce Innovation, Labor Market Statistics 13