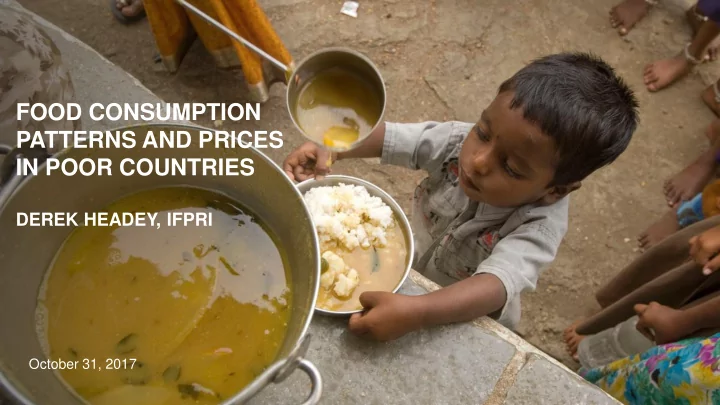

FOOD CONSUMPTION PATTERNS AND PRICES IN POOR COUNTRIES DEREK HEADEY, IFPRI October 31, 2017
QUESTIONS Where do poor consumers get their food from? How are consumption patterns changing? What are the major problems with infant diets?
AS INCOMES RISE, PROCESSED FOODS RISE The food private sector already reaches consumers in both rural and urban poor populations Percent of Monetary Value of Food Consumed from Different Categories Purchased: Purchased: Purchased: Own High Processed Low Processed Unprocessed Production Ethiopia 2004/05, Uganda 2009/10, Tanzania 2010/11, Mozambique 2008/09, Malawi 2001/11, South Africa 2010 Today: Rural Today: Urban Projected Change to 2040 (All) 100% 100% 100% 80% 80% 80% 60% 60% 60% 40% 40% 40% 20% 20% 20% 0% 0% 0% $0-2 $2-4 $4-10 $10-20 >$20 $0-2 $2-4 $4-10 $10-20 >$20 2010 2040 Very low Low Middle Upper High Very low Low Middle Upper High Middle Middle Source: Global Panel on Agriculture and Food Systems for Nutrition (2016) “Food Systems and diets: Facing the challenges of the 21 st century” Data compiled by authors, based on data in Tschirley et al. (2015). Unprocessed includes legumes, maize grain, vegetables, fresh fish. Processed low includes maize meal, milled rice, butchered meats, dried fish; Processed high includes 3 packaged snacks, refined vegetable oils, dairy, food away from home
INFANTS HAVE VERY LOW DIET DIVERSITY Poor diets are one of the major reasons children experiencing poor growth over the critical 6-23 month window of development Consumption Prevalence* (%) Cow’s Milk Overall Minimum Eggs Fortified complementary Diet Diversity food (infant cereals) 100 80 58 60 46 44 40 32 29 28 28 25 21 19 19 20 15 14 14 11 9 8 7 6 6 5 5 5 3 0 Indonesia India Bangladesh Nigeria Ethiopia Burkina Faso *Consumption recall based on past 24-hours, questions e.g.,: Any Commercially fortified baby food like Cerelac, Nutren, Frisolac H, Weatabix, etc.?
POOR HOUSEHOLDS FACE HIGH PRICES FOR KEY FOODS Diversifying diets is difficult due to high cost of other (nutritious) foods relative to staples Price-Per-Calorie Ratio Relative to Cheapest Staple 1 Pasta/Noodles Egg Fresh Milk 2 Fortified complementary food (infant cereals) USA Brazil India Nigeria 40 30.3 30 20 13.3 11.1 9.6 10 8.5 7.0 6.1 5.5 4.7 3.7 3.8 2.2 2.0 2.0 1.6 1.0 0 Source: World Bank International Comparison Program (United Nations Statistical Commission) 1. Staple of comparison is rice in India and Brazil, (packaged) bread in the U.S., maize flour for 5 Nigeria. 2. Powdered milk is more consistent across countries, at ~3-5x cheapest cereal in these sample countries
CONSUMERS AND AFFORDABILITY Increasing relative affordability can increase consumption, but the market fails to make some nutritious foods more affordable Consumption of fortified complementary foods within last 24-hour period 100% 80% 60% USA 1 Guatemala 40% 20% Ethiopia Indonesia India Bangladesh Nigeria 0% 0 10 20 30 40 50 Price of Fortified Complementary Food (Ratio to Cheapest Staple Cereal) 1) US consumption data does not come from DHS survey, estimate based on expert interviews 6 Source: World Bank International Comparison Program (United Nations Statistical Commission) with DHS consumption data
Recommend
More recommend