SLIDE 1
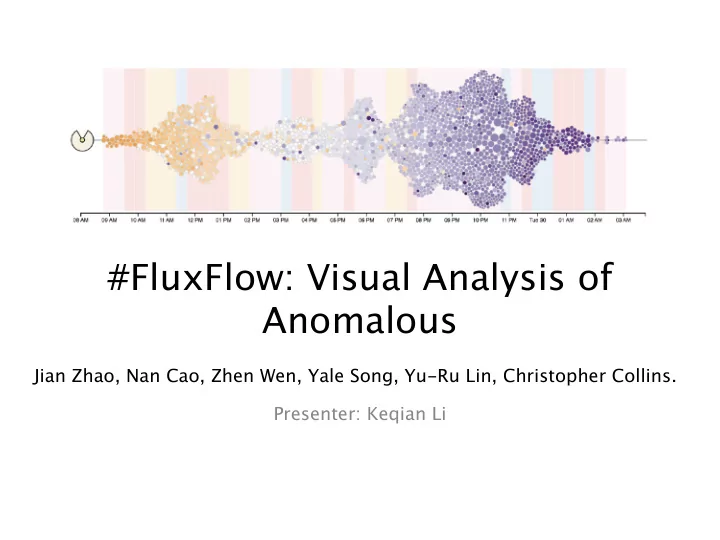
#FluxFlow: Visual Analysis of Anomalous
Presenter: Keqian Li Jian Zhao, Nan Cao, Zhen Wen, Yale Song, Yu-Ru Lin, Christopher Collins.
SLIDE 2
What: SOCIAL MEDIA
SLIDE 3
Why: Abnormal conversational threads
SLIDE 4
How: FluxFlow
SLIDE 5 Abnormal Retweet Threads Detection: A Data mining approach
- One-Class Conditional Random Fields Model
(OCCRF)
– temporal dependency, due to mechanism in RT time series data – one-class nature. There is little to no example (or even a clear definition) of true anomalies – contains a set of hidden variables to capture the underlying sub-structure of the sequential data
- Extracted Feature for each single retweet
– User profile features: counts of followers, friends, status – User network features: in-degree and out-degree – Temporal features: intervals between two adjacent tweets in the sequence
SLIDE 6
Data mining pipeline
SLIDE 7
RT Thread Visualization: RT Thread Glyph
SLIDE 8
RT Thread Visualization: RT Thread Timeline
SLIDE 9
System interface
SLIDE 10
Hierarchical cluster of RT threads by topics
SLIDE 11
MDS view of threads from high dimensional feature space
SLIDE 12
User social connections at the intra- or inter-thread level
SLIDE 13
Deep-Level Information for Input feature vectors, model hidden states, raw tweets
SLIDE 14
Visualization techniques summary
How:Encode Glyph, Thread Timelines How-Facet Multiform, Overview/ Detail. linked highlighting. How: Reduce Item filtering, Item aggregation, Attribute aggregation, Elide, Superimpose How: Manipulate Highlighting, Project, Zoom
SLIDE 15 Task Summary
- T1 Summarizing and aggregating important features of
retweeting threads. – Glyph, Cluster View, MDS View
- T2 Indicating characteristics and connections of involving
users. – User relationship graphs
- T3 Revealing temporal patterns of information spreading.
– Thread Timeline
- T4 Facilitating visual data comparisons and correlations.
– Cluster View, MDS View
- T5 Accessing deep-level information of the model and
input. – Thread Timeline, Features View, Status View, Tweets View
SLIDE 16 Evaluation
- Datasets: two 10% Twitter feed datasets collected
during two significant events: – 2012 Hurricane Sandy(52 million tweets) – 2013 Boston Marathon Bombing(242 million tweets)
- Baseline: One-Class SVM (OCSVM) [Scholkopf et al.,
2001]
- Ground truth: manually labeled by three annotators
to based on reports after the events
SLIDE 17
Comparison Results
Accuracies of OCCRF and OCSVM in correctly detecting rumors in the top-K retweeting threads ranked by the models in datasets: a) Hurricane Sandy, and b) Boston Bombing.
SLIDE 18
Case Study of Hurricane Sandy
SLIDE 19 Critiques
– Incorporate further content attribute(e.g., topics, tags, deeper semantic analysis)
– Improve on algorithm scalability and response time – Decouple with specific models – More insights about the model beyond hidden states, e.g. interactions of model parameters
– Timeline visualization need better reducing techniques to be scalable for real social network data – Better to show the “chain” of retweeting, and influence between users
– Stronger ground truth for quantitative evaluation
SLIDE 20
Thank you