
SLIDE 1
January 11, 2013
FlowViewer
Maintaining NASA’s Earth Science Traffic Situational Awareness
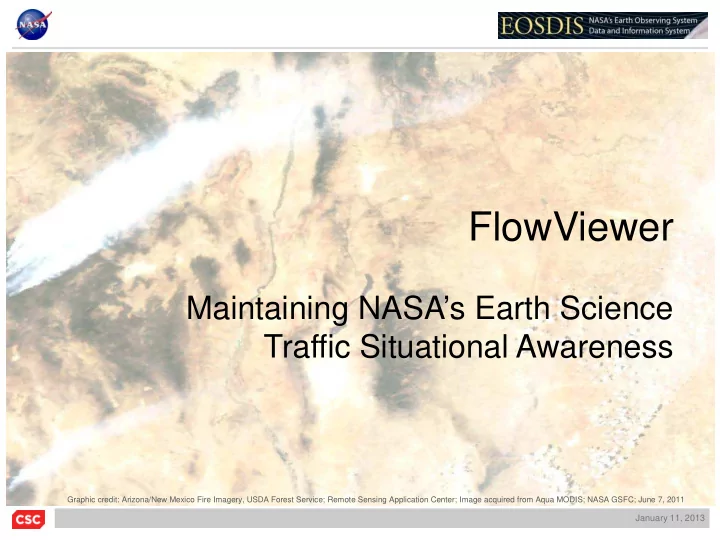
Graphic credit: Arizona/New Mexico Fire Imagery, USDA Forest Service; Remote Sensing Application Center; Image acquired from Aqua MODIS; NASA GSFC; June 7, 2011