flexural stiffness of gfrp composite orthodontic archwires
play

FLEXURAL STIFFNESS OF GFRP COMPOSITE ORTHODONTIC ARCHWIRES C. A. - PDF document

18 TH INTERNATIONAL CONFERENCE ON COMPOSITE MATERIALS FLEXURAL STIFFNESS OF GFRP COMPOSITE ORTHODONTIC ARCHWIRES C. A. Cimini Jr. 1 *, J. D. D. Melo 2 , A. M. Medeiros 2 , E. B. Las Casas 3 1 Department of Mechanical Design, UNICAMP, Campinas,


  1. 18 TH INTERNATIONAL CONFERENCE ON COMPOSITE MATERIALS FLEXURAL STIFFNESS OF GFRP COMPOSITE ORTHODONTIC ARCHWIRES C. A. Cimini Jr. 1 *, J. D. D. Melo 2 , A. M. Medeiros 2 , E. B. Las Casas 3 1 Department of Mechanical Design, UNICAMP, Campinas, Brazil 2 Department of Materials Engineering, UFRN, Natal, Brazil 3 Department of Structural Engineering, UFMG, Belo Horizonte, Brazil * C. A. Cimini Jr. ( cimini@fem.unicamp.br ) Keywords : orthodontic archwires, glass fiber reinforced plastics, flexural stiffness 1 Introduction In this work, a three-point bending test program was Tooth movement for correcting functional occlusion conducted according to the ISO Standard 15841 [5] is clinically obtained through the application of in commercially available orthodontic archwires, in light, but continuous forces imposed by an order to evaluate their flexural stiffness. Test orthodontic system composed by archwires and specimens were cut from circular cross section brackets, which are attached to the teeth. The load- GFRP archwires. Results were compared to stainless release system should behave elastically over the steel archwires data obtained from the literature. period of the treatment, from weeks to months. The introduction of new archwire materials led to a growing interest on 
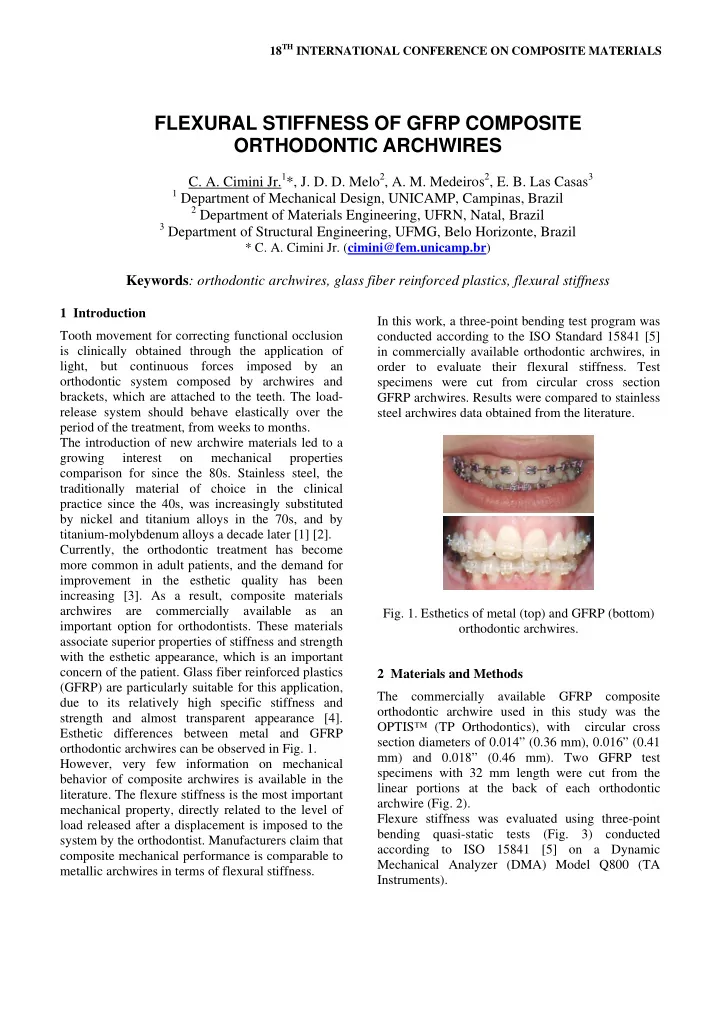
mechanical properties comparison for since the 80s. Stainless steel, the traditionally material of choice in the clinical practice since the 40s, was increasingly substituted by nickel and titanium alloys in the 70s, and by titanium-molybdenum alloys a decade later [1] [2]. Currently, the orthodontic treatment has become more common in adult patients, and the demand for improvement in the esthetic quality has been increasing [3]. As a result, composite materials archwires are commercially available as an Fig. 1. Esthetics of metal (top) and GFRP (bottom) important option for orthodontists. These materials orthodontic archwires. associate superior properties of stiffness and strength with the esthetic appearance, which is an important concern of the patient. Glass fiber reinforced plastics 2 Materials and Methods (GFRP) are particularly suitable for this application, The commercially available GFRP composite due to its relatively high specific stiffness and orthodontic archwire used in this study was the strength and almost transparent appearance [4]. OPTIS™ (TP Orthodontics), with circular cross Esthetic differences between metal and GFRP section diameters of 0.014” (0.36 mm), 0.016” (0.41 orthodontic archwires can be observed in Fig. 1. mm) and 0.018” (0.46 mm). Two GFRP test However, very few information on mechanical specimens with 32 mm length were cut from the behavior of composite archwires is available in the linear portions at the back of each orthodontic literature. The flexure stiffness is the most important archwire (Fig. 2). mechanical property, directly related to the level of Flexure stiffness was evaluated using three-point load released after a displacement is imposed to the bending quasi-static tests (Fig. 3) conducted system by the orthodontist. Manufacturers claim that according to ISO 15841 [5] on a Dynamic composite mechanical performance is comparable to Mechanical Analyzer (DMA) Model Q800 (TA metallic archwires in terms of flexural stiffness. Instruments).

  2. diameter archwires, and they were later submitted to three-point bending tests until midspan deflection of 2 mm (Fig. 4). For archwires with diameter of 0.016” (0.41 mm), four specimens were cut from two archwires, and flexural tests were conducted up L L to a maximum midspan deflection of 1 mm, reduced in order to avoid damage (Fig. 5). This same 1 mm maximum midspan deflection was used to test the five test specimens cut from three 0.018” (0.46 mm) Fig. 2. OPTIS™ Superior Straight Arch and regions diameter archwires (Fig. 6). A relatively high scatter where specimens were cut. is observed in Figs. 4, 5 and 6 with respect to the stiffness (slope of the load vs. displacement curves). wire 0,014" 2,5 wire 1 10 mm wire 2 2 wire 3 Force (N) 1,5 wire 4 Fig. 3. Three-point bending creep test schematic wire 5 1 view (left) and test setup (right). 0,5 GFRP archwires stiffness was measured from the linear portion of the load-displacement diagrams. 0 The Young’s Modulus was calculated from Eq. (1) 0 500 1000 1500 2000 Displacement (µm) obtained from the expression for midspan deflection in a three-point bending simply supported beam: Fig. 4. Load vs. displacement results for 0.014” 3 P L (0.36 mm) diameter archwire test specimens.  E (1)  48 I where P is the applied load, L is the bending span,  wire 0,016" is the midspan deflection and I is the moment of 2,5 inertia. wire 1 2 Stainless steel data was obtained from the work of wire 2 wire 3 Andreasen and Hillerman [6] also for 0.014” (0.36 Force (N) 1,5 wire 4 mm), 0.016” (0.41 mm) and 0.018” (0.46 mm) archwires. 1 0,5 3 Results 0 0 500 1000 1500 2000 Stiffness. A three-point bending test program was Displacement (µm) conducted to evaluate the GFRP archwires stiffness. Results are presented in the form of load vs. Fig. 5. Load vs. displacement results for 0.016” displacement plots in Figs. 4, 5 and 6, respectively (0.41 mm) diameter archwire test specimens. for archwires with diameters of 0.014” (0.36 mm), 0.016” (0.41 mm) and 0.018” (0.46 mm). Five test specimens were cut from three 0.014” (0.36 mm)

  3. GFRP COMPOSITE ORTHODONTIC ARCHWIRES wire 0,018" 2,5 wire 1 wire 2 2 Wire 1 I Wire 1 II III Wire 1 wire 3 Force (N) 1,5 wire 4 wire 5 1 0,5 I Wire 2 II Wire 2 III Wire 2 0 0 500 1000 1500 2000 Displacement (µm) Fig. 6. Load vs. displacement results for 0.018” I Wire 3 II Wire 3 III Wire 3 (0.46 mm) diameter archwire test specimens. Fig. 8. Cross section images for three samples of Fiber distribution. Further investigation on the 0.014” (0.36 mm) archwire. fiber distribution along the archwire length showed severe non-uniformity of fiber distribution with large resin rich areas, probably due to the manufacturing process. Samples from archwires, for each diameter, were cut in three points (I, II and III) I Wire 1 II Wire 1 III Wire 1 as shown in Fig. 7. Cross sections were polished and photographed using an optical microscope. II I Wire 2 II III Wire 2 Wire 2 III I I Wire 3 II Wire 3 III Wire 3 Fig. 9. Cross section images for three samples of Fig. 7. Archwire cut sections. 0.016” (0.41 mm) archwire. Figures 8, 9 and 10 show cross section microscope photographs of cross sections respectively for samples of GFRP archwires with diameters of 0.014” (0.36 mm), 0.016” (0.41 mm) and 0.018” Wire 1 I Wire 1 II III Wire 1 (0.46 mm). It can be observed from these figures that fiber distribution is not uniform at different cross sections along the archwires, which can explain the scatter found in the bending test results. Fiber concentration and resin rich areas drastically I Wire 2 II Wire 2 III Wire 2 affect the cross section flexural behavior. Fig. 10. Cross section images for two samples of 0.018” (0.46 mm) archwire. 3

  4. Young’s Modulus in fiber direction ( E 1 ). GFRP Young’s Modulus was evaluated from test data 0.018” v f = 37% using Eq. (1), and predicted using fiber volume fractions considering micromechanics rule of mixtures with typical values for E-Glass/Epoxy systems (fiber modulus E f = 72 GPa, and lamina modulus on the fiber direction E 1 = 38 GPa for a fiber volume fraction of v f = 50%). Fiber volume fractions ( v f ) for the GFRP archwires were evaluated using computer image processing tools for the microphotographs of the cross sections. Fiber volume fractions were consistently constant for each 100  m one of the diameters, indicating a finite number of continuous fibers along the archwire. Figures 11, 12 Fig. 13. Cross section image of 0.018” (0.46 mm) and 13 show microscope photographs of cross archwire with measured fiber volume fraction. sections with fiber volume fractions evaluated for archwires respectively with diameter of 0.014” (0.36 Table 1 shows the comparison for the Young’s mm), 0.016” (0.41 mm) and 0.018” (0.46 mm). Modulus in fiber direction ( E 1 ) evaluated from test data and predicted using micromechanics. These v f = 32% 0.014” results are plotted in Fig. 14. It can be observed that micromechanics over predicted the Young’s Modulus in the fiber direction. The large difference between the prediction and test values can be attributed to the non-uniform distribution of the fibers in the cross sections along the archwires, as previously commented. Flexural results are very sensitive to the cross section inertia and consequently to the fiber distribution. 100  m Micromechanics Eq. (1) Archwire prediction Fig. 11. Cross section image of 0.014” (0.36 mm) Diameter  E 1 E 1 v f archwire with measured fiber volume fraction. 0.014” 15.94 1.73 25.76 0.32 (0.36 mm) 0.016” v f = 33% 0.016” 19.26 1.39 26.44 0.33 (0.36 mm) 0.018” 20.39 2.65 29.16 0.37 (0.36 mm) E 1 – Young’s Modulus in fiber direction (GPa)  – Standard deviation (GPa) v f – Fiber volume fraction 100  m Tab. 1. Three-point bending test flexural stiffness. Fig. 12. Cross section images of 0.016” (0.41 mm) archwire with measured fiber volume fraction.

Download Presentation
Download Policy: The content available on the website is offered to you 'AS IS' for your personal information and use only. It cannot be commercialized, licensed, or distributed on other websites without prior consent from the author. To download a presentation, simply click this link. If you encounter any difficulties during the download process, it's possible that the publisher has removed the file from their server.

Recommend


More recommend