
SLIDE 1
1
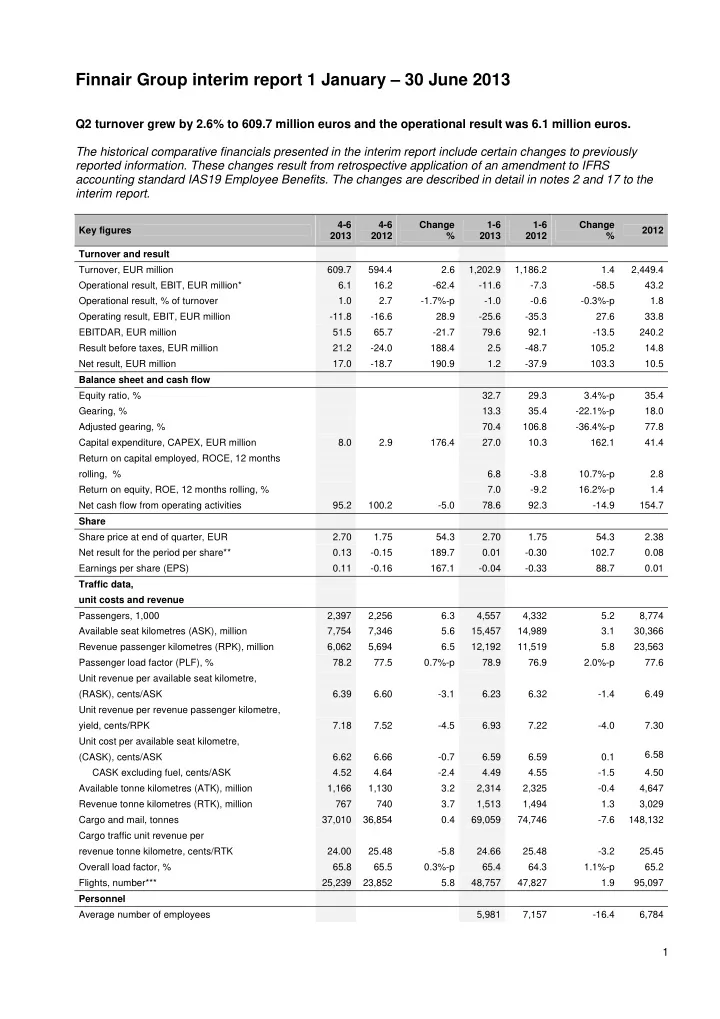
Finnair Group interim report 1 January – 30 June 2013
Q2 turnover grew by 2.6% to 609.7 million euros and the operational result was 6.1 million euros. The historical comparative financials presented in the interim report include certain changes to previously reported information. These changes result from retrospective application of an amendment to IFRS accounting standard IAS19 Employee Benefits. The changes are described in detail in notes 2 and 17 to the interim report.
Key figures 4-6 2013 4-6 2012 Change % 1-6 2013 1-6 2012 Change % 2012 Turnover and result Turnover, EUR million 609.7 594.4 2.6 1,202.9 1,186.2 1.4 2,449.4 Operational result, EBIT, EUR million* 6.1 16.2
- 62.4
- 11.6
- 7.3
- 58.5
43.2 Operational result, % of turnover 1.0 2.7
- 1.7%-p
- 1.0
- 0.6
- 0.3%-p
1.8 Operating result, EBIT, EUR million
- 11.8
- 16.6
28.9
- 25.6
- 35.3
27.6 33.8 EBITDAR, EUR million 51.5 65.7
- 21.7
79.6 92.1
- 13.5
240.2 Result before taxes, EUR million 21.2
- 24.0
188.4 2.5
- 48.7
105.2 14.8 Net result, EUR million 17.0
- 18.7
190.9 1.2
- 37.9
103.3 10.5 Balance sheet and cash flow Equity ratio, % 32.7 29.3 3.4%-p 35.4 Gearing, % 13.3 35.4
- 22.1%-p
18.0 Adjusted gearing, % 70.4 106.8
- 36.4%-p
77.8 Capital expenditure, CAPEX, EUR million 8.0 2.9 176.4 27.0 10.3 162.1 41.4 Return on capital employed, ROCE, 12 months rolling, % 6.8
- 3.8
10.7%-p 2.8 Return on equity, ROE, 12 months rolling, % 7.0
- 9.2
16.2%-p 1.4 Net cash flow from operating activities 95.2 100.2
- 5.0
78.6 92.3
- 14.9
154.7 Share Share price at end of quarter, EUR 2.70 1.75 54.3 2.70 1.75 54.3 2.38 Net result for the period per share** 0.13
- 0.15
189.7 0.01
- 0.30
102.7 0.08 Earnings per share (EPS) 0.11
- 0.16
167.1
- 0.04
- 0.33
88.7 0.01 Traffic data, unit costs and revenue Passengers, 1,000 2,397 2,256 6.3 4,557 4,332 5.2 8,774 Available seat kilometres (ASK), million 7,754 7,346 5.6 15,457 14,989 3.1 30,366 Revenue passenger kilometres (RPK), million 6,062 5,694 6.5 12,192 11,519 5.8 23,563 Passenger load factor (PLF), % 78.2 77.5 0.7%-p 78.9 76.9 2.0%-p 77.6 Unit revenue per available seat kilometre, (RASK), cents/ASK 6.39 6.60
- 3.1
6.23 6.32
- 1.4
6.49 Unit revenue per revenue passenger kilometre, yield, cents/RPK 7.18 7.52
- 4.5
6.93 7.22
- 4.0
7.30 Unit cost per available seat kilometre, (CASK), cents/ASK 6.62 6.66
- 0.7
6.59 6.59 0.1 6.58 CASK excluding fuel, cents/ASK 4.52 4.64
- 2.4
4.49 4.55
- 1.5
4.50 Available tonne kilometres (ATK), million 1,166 1,130 3.2 2,314 2,325
- 0.4
4,647 Revenue tonne kilometres (RTK), million 767 740 3.7 1,513 1,494 1.3 3,029 Cargo and mail, tonnes 37,010 36,854 0.4 69,059 74,746
- 7.6
148,132 Cargo traffic unit revenue per revenue tonne kilometre, cents/RTK 24.00 25.48
- 5.8
24.66 25.48
- 3.2
25.45 Overall load factor, % 65.8 65.5 0.3%-p 65.4 64.3 1.1%-p 65.2 Flights, number*** 25,239 23,852 5.8 48,757 47,827 1.9 95,097 Personnel Average number of employees 5,981 7,157
- 16.4