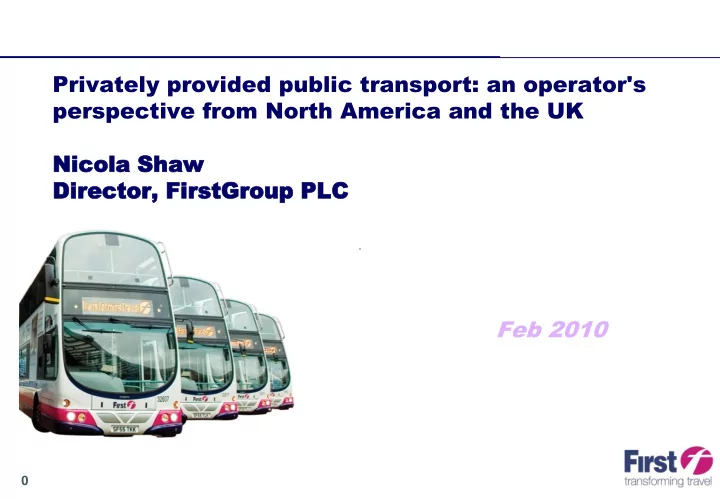
SLIDE 1 Privately provided public transport: an operator's perspective from North America and the UK Nicola
Shaw Dir irecto ctor, , FirstGro stGroup p PL PLC Feb 2010
SLIDE 2 1
Overview
An introduction to FirstGroup The UK Bus Industry
A quick history What do customers want? How do we attract more customers? What do employees want? What do politicians want? Where now?
The Public Policy Debate FGA Transit An Advert
SLIDE 3
2
FirstGroup Business Overview
UK No. 1 23% market share 8,500 buses Bus, coach, yellow school bus and rail replacement 3 million passengers a day Some 25,000 employees UK No. 1 Operating one quarter of the UK passenger rail network 5 passenger rail operations (4 franchises, 1 open access) & rail freight operation More than 280 million passengers a year Some 13,000 employees UK Bus UK Rail
We are the largest UK-listed surface transport group: Transport some 2.5 billion passengers a year Annualised revenues of over £6bn More than 130,000 employees
US No. 1 60,000 yellow school buses Greyhound intercity coach services Transit management & contracting Vehicle maintenance & support services 4 million students to and from school every day Some 94,000 employees North America
SLIDE 4 3
Public policy and ownership changes
1967 – last major private bus operator sold to the Government 1986 – deregulation 1988 – 89 National Bus Co. sold by Government (as 70 lots) 1990 – 91 Scottish Bus Group sold 1993 – 95 London bus operating companies sold Now
Outside London c. 80% network private sector planned and delivered London network 100% privately operated under contract to Government
SLIDE 5
4
FirstGroup’s GB Bus operations
1986 1990 1995 2000 2010
SLIDE 6
5
Bus Industry Margins
SLIDE 7 6
Customer Satisfaction
Passenger Focus initial surveys of satisfaction in 2009
90% 0% 10% 20% 30% 40% 50% 60% 70% 80% 90% 100% Lincolnshire Tyne & Wear Dorset Southampton West Midlands Bristol Overall Proportion of passengers satisfied with their trip
SLIDE 8
7
Long Term Trends in the Bus Market
SLIDE 9 8
What do customers want?
Source: Passengers Focus surveys 2009
SLIDE 10
9
Do something else with your time
SLIDE 11
10
Good information
SLIDE 12
11
Bad information
SLIDE 13
12
Good interchange
SLIDE 14
13
Not so good interchange
SLIDE 15
14
The environment
SLIDE 16 15
Hybrid Buses
£k 15 years Diesel Hybrid Diff Purchase 175 275
Fuel cost 269 230 39 Duty saving
54 Maintenance cost 201 242
Total 645 693
SLIDE 17
16
Jobs in the UK Bus and Coach Industry
SLIDE 18
17
Government funding in the bus industry
100 200 300 400 500 600 700 1994 1996 1998 2000 2002 2004 £m English PTEs London Shires
SLIDE 19 18
Public Policy Debate
Ownership
General acceptance that the private sector will deliver more efficiently
Control
Frequency of service changes
Price and ticketing integration
Vehicle quality
Information provision
Driver training and behaviour
Partnership
Voluntary agreements
Statutory schemes
What does it really mean?
Quality Contract
Area based
In the public interest
No compensation for incumbents
Transition issues
Competition
New review of the market by the Competition Commission
SLIDE 20 19
First Transit Market
Fixed Route $15 billion
In-house/conversion ~ $13.5B, 90%
Contracted/share shift ~ $1.5B, 10%
First Transit Fixed Route $330 million
Total market share ~ 2%
Total contracted share ~ 22%
SLIDE 21
20
Redefining coach travel in the US and the UK
SLIDE 22
21
Keeping passengers happy the older way too!
SLIDE 23 22
Career / management lessons
Modelling and the reality of life
Inertia of what you already have
Elasticity based modelling dominates
Team work
Running a business you MUST understand / be familiar with all aspects
Never underestimate the power of the distraction
Public private partnership
Social contract
The economic cycle
The long bath