feasibility study on machine learning algorithm in
play

Feasibility study on machine learning algorithm in nuclear reactor - PDF document

Transactions of the Korean Nuclear Society Virtual Spring Meeting July 9-10, 2020 Feasibility study on machine learning algorithm in nuclear reactor core diagnosis Hanjoo Kim a , Dongmin Yun a , Ho Cheol Shin b , Sang Rae Moon b , Deokjung Lee a*


  1. Transactions of the Korean Nuclear Society Virtual Spring Meeting July 9-10, 2020 Feasibility study on machine learning algorithm in nuclear reactor core diagnosis Hanjoo Kim a , Dongmin Yun a , Ho Cheol Shin b , Sang Rae Moon b , Deokjung Lee a* a Department of Nuclear Engineering, Ulsan National Institute of Science and Technology UNIST-gil 50, Ulsan, 44919 b Core and Fuel Analysis Group, Korea Hydro & Nuclear Power Central Research Institute (KHNP-CRI), Daejeon, 34101 * Corresponding author: deokjung@unist.ac.kr 1. Introduction The structure of data generation is shown in Figure 1. In this study, 4 th cycle of OPR1000 type reactor with Due to current trend of light water reactors (LWRs), full core model is used as base model of the dataset high thermal power, obsolescence, long-cycle, and generation. water chemistry management, the importance of nuclear reactor core monitoring has been increased since early diagnostics of core abnormal state, and follow-up measures on it can reduce costs caused by the abnormal state. In this study, a reactor core diagnostics program based on machine learning (ML) algorithm is under development to improve the current reactor core monitoring system which is based on operator ’ s proficiency. Due to the limitation of obtaining enough operation data to train and test a ML algorithm classifying various reactor core conditions, a nuclear core analysis code, RAST-K, is employed to generate dataset. Reactor abnormal conditions such as CRUD induced power shift (CIPS) and control rod mis- Figure 1. Data generation system structure location are modeled, and each model with randomly perturbated input parameters are labeled. Supervised 2.2. CRUD occurrence core model learning is performed, such that control rod positions and detector signal data with corresponding label of To model the core model with CRUD accumulation, reactor core conditions is used as training data of the a simple CRUD accumulation model is implemented in ML models. Since the final goal of the ML model is the RAST-K. The CRUD thickness of a fuel assembly node is defined with CRUD multiplication factor (  ) being implemented in reactor core monitoring system, detector signal and control rods data which also can be and subcooled nucleate boiling mass ( SNB ) as mass observed by reactor operators are used as input of the follow: ML model.  =   SNB . (1) 2. Training data generation CRUD mass The boron number increase at i th depletion burnup 2.1. Data generation system step is Training an ML model requires huge amount of =     dN ND dV (if ) , (2) dataset to achieve high performance of it. For this B B CRUD CRUD threshold reason, training dataset generation system named AUTOGEN has been established. The reactor analysis where the CRUD volume increase is determined with code RAST-K [1] is embedded in the system to the node height ( h ), the CRUD porosity ( k ), and porosity compute detector signals [2] used in training of ML the outer radius of the CRUD layer ( CRUD r ) as models. The data generation system is written by 
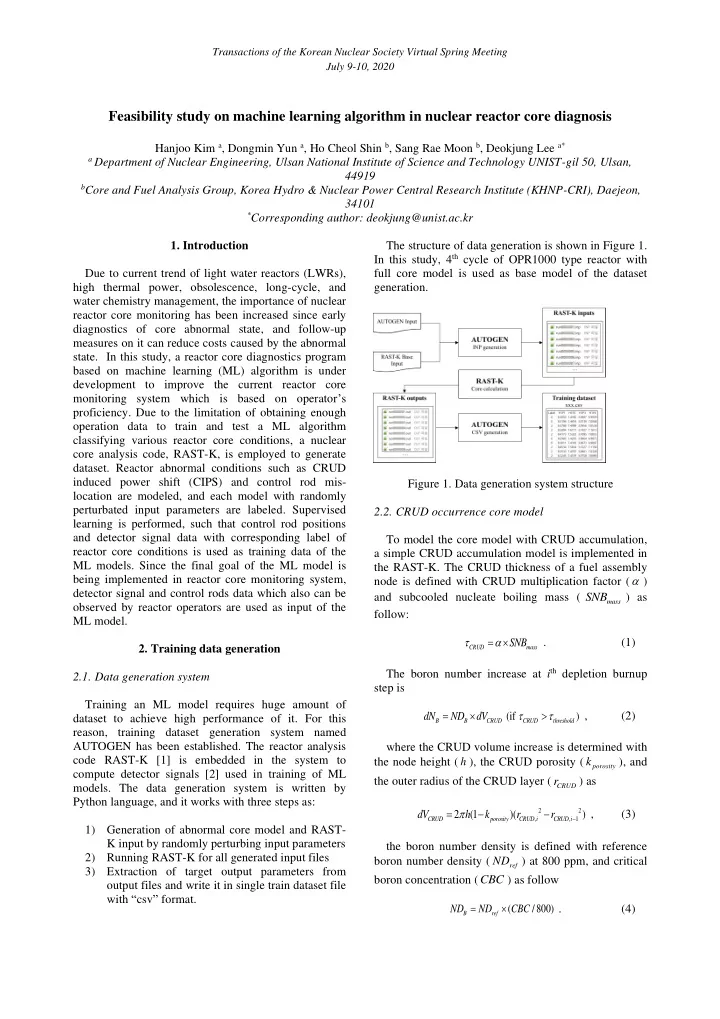
Python language, and it works with three steps as: =  − − 2 2 dV 2 h (1 k )( r r ) , (3) − , , 1 CRUD porosity CRUD i CRUD i 1) Generation of abnormal core model and RAST- K input by randomly perturbing input parameters the boron number density is defined with reference 2) Running RAST-K for all generated input files boron number density ( ND ) at 800 ppm, and critical ref 3) Extraction of target output parameters from boron concentration ( CBC ) as follow output files and write it in single train dataset file with “ csv ” format. =  ND ND ( CBC /800) . (4) B ref

  2. Transactions of the Korean Nuclear Society Virtual Spring Meeting July 9-10, 2020 Since it was analyzed that the minimum thickness of the CRUD for CIPS is 30 μm [3], threshold thickness In this study, 10,000 input files with 21 burnup steps  ) for boron holdup is 30 μm . were generated and calculated, giving 210,000 snap- ( threshold shop data. In the training and testing a ML model which The core average CRUD thickness is shown in Figure classifies CRUD occurrence, 30,000 data was used for 2 and it shows growth of CRUD during the operation. middle of cycle (MOC) and end of cycle (EOC), respectively. The core burnup for MOC data is 5.0 ~ 7.0 GWd/MTU, and the core burnup for EOC data is 15.0~17.0 GWd/MTU. Table 1. Dataset for CRUD occurrence model Burnup Power Total Normal Abnormal MOC 100% 30,000 18,844 11,156 EOC 100% 30,000 12,969 17,031 2.3. Control rods mis-location core model Reactor core abnormal condition with control rods mis-location is modeled. The model represents a core condition where a CEA position is different with other CEAs in the same sub-group, and thus, it can cause power tilt during the operation. The core model is Figure 2. CRUD thickness increases labeled as control rod mis-location if the difference of CEA position exceeds 8.52 cm. The criterion of 8.52 Figure 3 shows comparison of ASI between core cm is defined with minimum rod worth of a regulating models with CRUD and without CRUD. Since boron  bank ( ), acceptable design uncertainty of control holdup requires minimum thickness of CRUD, ASI R ,min starts to change from 2.0 GWd/MTU. Since CRUD rod worth (10% or 100 pcm), maximum differential rod  accumulation and boron holdup appear at upper region d worth of a shutdown bank ( ) as of fuel assemblies (FAs), ASI is higher with CRUD, dh S ,max and it is lower at the end of cycle (EOC) due to low burnup of fuel at upper region.  =  R ,min . (5) h 10%  criteria d dh S ,max Since 25.15 cm of the difference is a criterion used in OPR1000 reactor to reactor shutdown, 8.52 cm of the difference in this study is adjustable to develop a ML model for early diagnostics. Control rods in OPR1000 reactor are driven by a motor having steps of 1.905 cm Figure 3. ASI comparison with CRUD occurrence [4] and thus, control rod position is determined by sampling number of control rod steps. The procedure to generate control rod mis-location model is: In generation of core models with CRUD occurrence, CRUD multiplication factor (  ) is perturbed to 1) Randomly sample the regulating bank position generate various core conditions caused by CRUD satisfying PDIL to determine normal core accumulation. 1% difference of ASI is selected as a condition. criterion for labelling CIPS data. Once CIPS occurs at 2) Randomly select a CEA out of 73 CEAs to certain burnup step, core operation data from the perturb control rod position. burnup step are labelled as CIPS. The procedure to 3) Sample the number of steps to insert or withdraw generate the CRUD accumulated model is as follow: 4) If the sampled step is more than 5 steps, the core model is labeled as control rod mis-location. 1) Randomly select CRUD multiplication factor 5) Perform core calculation by using RAST-K. with uniform distribution from 1E-6 to 1.5E-5. 6) Repeat 1) ~ 5). 2) Perform steady state depletion calculation from 0 to 17.0 GWd/MTU by using RAST-K. 10,000 data of control rod mis-location model were 3) Labelling the data as CIPS or normal if ASI generated for BOC, 50,000 data for MOC and EOC difference exceeds 1%. 4) Repeat 1) ~ 3).

Download Presentation
Download Policy: The content available on the website is offered to you 'AS IS' for your personal information and use only. It cannot be commercialized, licensed, or distributed on other websites without prior consent from the author. To download a presentation, simply click this link. If you encounter any difficulties during the download process, it's possible that the publisher has removed the file from their server.

Recommend


More recommend