farm financial situation and strategies for 2020 2025
play

Farm Financial Situation and Strategies for 2020-2025 US Farm - PDF document

11/5/2019 Overview Farm Financial Situation and Strategies for 2020-2025 US Farm Finances Iowa Farm Finances Strategies for Next 5 years Alejandro Plastina, Ph.D. Assistant Professor/Extension Economist Department of Economics


  1. 11/5/2019 Overview Farm Financial Situation and Strategies for 2020-2025 • US Farm Finances • Iowa Farm Finances • Strategies for Next 5 years Alejandro Plastina, Ph.D. Assistant Professor/Extension Economist Department of Economics Pro-Ag Waterloo, IA – Nov 6, 2019 U.S. S. Ne Net t Farm m Income me (NF NFI) and Ne Net t 2019 Projections for U.S. Farm Sector Cash Farm m Income me (NC NCFI) • 
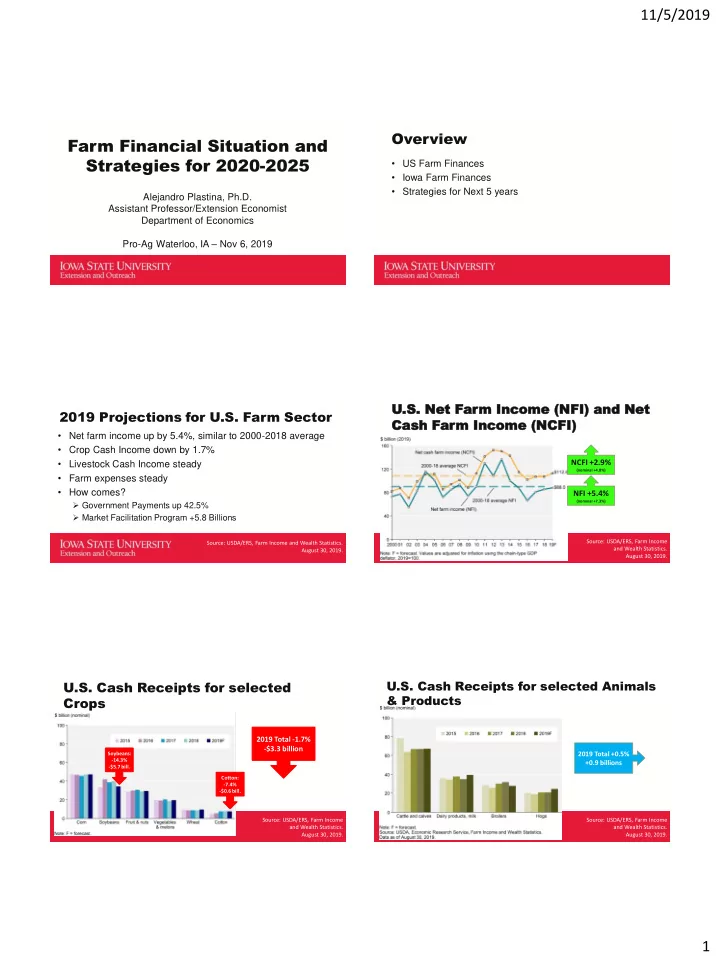
Net farm income up by 5.4%, similar to 2000-2018 average • Crop Cash Income down by 1.7% • Livestock Cash Income steady NCFI +2.9% (nominal +4.8%) • Farm expenses steady • How comes? NFI +5.4% (nominal +7.3%)  Government Payments up 42.5%  Market Facilitation Program +5.8 Billions Source: USDA/ERS, Farm Income Source: USDA/ERS, Farm Income and Wealth Statistics. and Wealth Statistics. August 30, 2019. August 30, 2019. U.S. Cash Receipts for selected Animals U.S. Cash Receipts for selected & Products Crops 2019 Total -1.7% -$3.3 billion Soybeans: 2019 Total +0.5% -14.3% +0.9 billions -$5.7 bill. Cotton: -7.4% -$0.6 bill. Source: USDA/ERS, Farm Income Source: USDA/ERS, Farm Income and Wealth Statistics. and Wealth Statistics. August 30, 2019. August 30, 2019. 1

  2. 11/5/2019 Changes in Production Expenses: U.S. Farm Production Expenses 2019F vs. 2018 2019 Nominal Steady Inflation- Adjusted ↓ Source: USDA/ERS, Farm Income Source: USDA/ERS, Farm Income and Wealth Statistics. and Wealth Statistics. August 30, 2019. August 30, 2019. Go Government Farm m Program m Payme yments ts U.S. Farm m Sector tor Liquidity ty Working Capital ($1,000) Current Ratio 180 3.0 Millions 160 2.5 2019 FP Payments +42.5% 140 120 2.0 100 MFP +5.8 billion 1.5 80 60 1.0 40 0.5 20 0 0.0 Source: USDA/ERS, Farm Income and Wealth Statistics. August 30, 2019. Source: USDA/ERS, Farm Income and Wealth Statistics. August 30, 2019. U.S. Farm Sector Assets U.S. Farm Sector Liabilities Source: USDA/ERS, Farm Source: USDA/ERS, Farm Income and Wealth Statistics. Income and Wealth Statistics. August 30, 2019. August 30, 2019. 2

  3. 11/5/2019 U.S. Farm m Sector tor Solvency Financial Situation of Iowa Farms • Data from Iowa Farm Business Association • Mid-size commercial farms • Most recent data from December 2018 Source: USDA/ERS, Farm Income and Wealth Statistics. August 30, 2019. Net Farm Income in Iowa Iowa Farms: Profitability Cash and Accrual (nominal) Operating Profit Margin Rate of Return on Assets Rate of Return on Equity $250,000 35% NFI Accrual $200,000 30% NFI Cash 25% $150,000 20% $100,000 $86,480 15% $58,832 $50,000 10% 5% $0 2.2% 1999 2000 2001 2002 2003 2004 2005 2006 2007 2008 2009 2010 2011 2012 2013 2014 2015 2016 2017 2018 0% 1.4% NFI Accrual = NFI Cash – Economic Source: Iowa Farm Costs and Returns . Depreciation + Changes in Inventories Source: Iowa Farm Costs and Returns . Ag Decision Maker File C1-10. Various years. Ag Decision Maker File C1-10. Various years. Iowa Farms: Liquidity and Solvency Iowa Farms: Liquidity Working Capital Current Ratio $600,000 8 December 2018 : $500,000 • 6 Liquidity slightly up $400,000 • Liabilities slightly down $300,000 4 $200,000 2 $100,000 $0 0 2008 2009 2010 2011 2012 2013 2014 2015 2016 2017 2018 Source: Plastina, A. 2019. “Farm Source: Iowa Farm Costs and Returns . liquidity slightly up, but still subdued.” Ag Decision Maker File C1-10. Various years. AgDM Newsletter Vol. 23, No. 12. 3

  4. 11/5/2019 Cumulative Working Capital Burn Rate per acre since 2014, Iowa Farms by Liquidity Status (N=214) by Liquidity Status in 2018 2015 2016 2017 2018 Percent of Farms by Liquidity Status $0 -$50 33.6 33.6 38.8 41.1 -$100 45.8 Strong (CR>2) -$150 -$139 Normal (1.3<CR≤2.0) 21.5 22.4 -$200 -$189.04 -$189 14.5 21.0 Vulnerable (CR≤1.3) -$215 -$250 22.9 -$237 -$276.65 -$300 -$286.66 -$306.60 44.4 44.9 43.9 40.2 -$350 31.3 Vulnerable (CR≤1.3) Normal (1.3<CR≤2.0) Strong (CR>2) All Farms Source: Plastina, A. 2019. “Farm liquidity slightly up, Based on Plastina, A. 2019. “Farm liquidity slightly up, but still subdued.” 2014 2015 2016 2017 2018 but still subdued.” AgDM AgDM Newsletter 23 (12). Newsletter Vol. 23, No. 12. Iowa Farms: Solvency Projected Corn, Soybean Prices (Land & Machinery at Cost Value) Corn Price, U.S. Farms Soybean Price, U.S. Farms Net Worth per Acre ($ nominal) Debt-to-Asset Ratio 4.50 10.00 $8,000 30% 4.00 9.00 $7,000 8.00 3.50 25% 7.00 3.00 $6,000 6.00 20% 2.50 $5,000 5.00 2.00 4.00 $4,000 15% 1.50 3.00 1.00 $3,000 2.00 10% 0.50 1.00 $2,000 0.00 0.00 5% $1,000 $0 0% 2008 2009 2010 2011 2012 2013 2014 2015 2016 2017 2018 USDA FAPRI USDA FAPRI Sources: Source: Iowa Farm Costs and Returns . FAPRI-MU Bulletin #03-19. October 2019. Ag Decision Maker File C1-10. Various years. USDA/OCE Long-Term Agricultural Projections. October 2019. Strategies: Slide from “Managing Tight Margins,” by Plastina & Hart 1. Revise production costs December 2015-January 2016 St Strategies gies to o mana manage ge mar margins gins • Revise production plans, especially on rented land • Can you make changes that generate savings that offset reductions in revenue? • Major concern: cash flow / liquidity Visit with Agronomist. Example:  Switch to seeds with fewer traits (+crop management)? Net savings • Solvency hit, but still strong: $25/acre. – Declining land values in Iowa  If yield  smaller than 7.2 bu/acre @ $3.50/bu, GO AHEAD! – Declining machinery values  Otherwise, NO GO. 5-10 • Long term problem  strategy for 2-3 years • Seek volume discounts in seeds, chemicals, etc. years! • Is input supply financing with low interest rate & no discount cheaper than traditional lending with higher interest rate & fall discount? 4

  5. 11/5/2019 Strategies: Strategies: 2. Actively Manage Risks 3. Limit working capital needs • Know your break-even prices • Revise: • Design a marketing plan with price and – share of rented land date targets and stick to it – planting decisions in low yielding areas • Revise crop insurance: SCO for shallow – fixed costs over next 5 years loss? • Revise use of forward contracts & crop • Do you really need new machinery? insurance to finance inputs • Can you lease used equipment instead? • Lock-in margins whenever possible Strategies: Strategies: 5. Revise family living expenses 4. Diversify Income • Add or don’t lose non -farm income • Can big-ticket items be avoided/postponed? • Consider alternative sources of revenue with your assets: – Truck purchase custom work, snow removal, truck driving in fall & winter, ??? – House remodeling plans – Luxury vacation plans – Lake House Strategies: Strategies: 6. Secure repayment capacity 7. Revise Growth Strategy • Work a plan with your lender(s) for 2019-2024 • Align short term needs with long term growth goals • Extend repayment schedules for existing loans to free up working • Offload unproductive assets capital • If needed, use land equity to inject liquidity or repay short-term Depending on your growth stage: loans • Downsize • Take Action! if interest rates go up, or land/machinery values go down, less bang for the buck (of equity). • Slow down growth • Selling machinery, land can trigger capital gain taxes, depreciation • Beginning farmers: wait to buy land recapture, reducing disposable net revenue from sale 5

  6. 11/5/2019 Strategies: Strategies: 8. Choose ARC/PLC Program 9. Develop a Plan B 1. 2019 Black Hawk Co: No ARC-CO $; PLC Corn $10.91/acre • Protect your Cash Reserves ARC-CO Corn ARC-CO Soybeans • Secure Emergency Loan terms in advance  talk to your Lender(s) 2. Update PLC yields (AgDM File A1-35) • List Assets that could be sold to generate liquidity after taxes  consult Tax Advisor • How much equity are you willing to lose before exiting? 3. Elect ARC/PLC for 2019-2020 (AgDM File A1-33) • Is it time to develop a transition plan? Summary Thank you for your attention! • Farm Income and Liquidity dependent on Government Payments • Visit with: Questions? Comments?  Agronomist – where to cut costs?  Family – living expenses? Alejandro Plastina  Lender – refinance, lower annual payments? plastina@iastate.edu  Tax advisor – value of assets after taxes? (515) 294-6160  Crop Insurance Agent – enterprise/basic units? SCO? https://www2.econ.iastate.edu/faculty/plastina/ • Resources in Ag Decision Maker website 6

Download Presentation
Download Policy: The content available on the website is offered to you 'AS IS' for your personal information and use only. It cannot be commercialized, licensed, or distributed on other websites without prior consent from the author. To download a presentation, simply click this link. If you encounter any difficulties during the download process, it's possible that the publisher has removed the file from their server.

Recommend


More recommend