
SLIDE 1
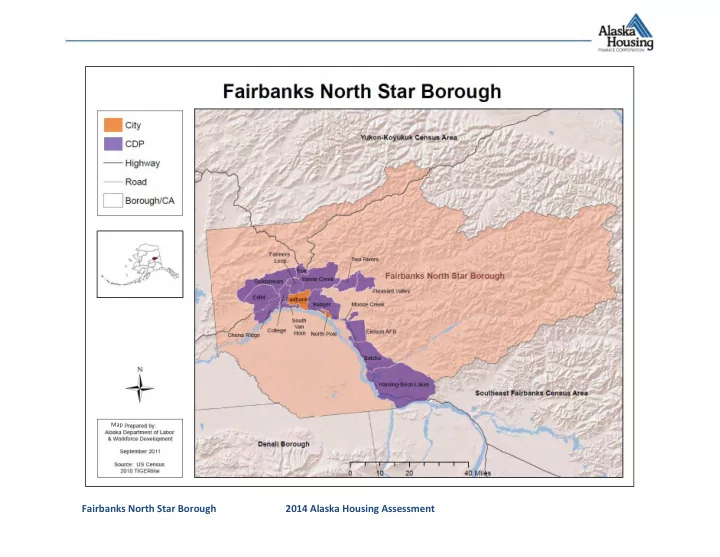
Fairbanks North Star Borough 2014 Alaska Housing Assessment
Wiltse, N., D. Madden, B. Valentine, V. Stevens
Map
Fairbanks North Star Borough 2014 Alaska Housing Assessment Wiltse, - - PowerPoint PPT Presentation
Map Fairbanks North Star Borough 2014 Alaska Housing Assessment Wiltse, N., D. Madden, B. Valentine, V. Stevens Table of Contents Fairbanks North Star Borough Dashboard
Wiltse, N., D. Madden, B. Valentine, V. Stevens
Map
1 CCHRC's analysis of ACS energy costs indicate that there are systematic underestimations for rural Alaska, which suggests that ACS-based cost burdened
Number Percent 2,064 6% Units 1,672 5% 1,421 543 2276 1,617 Housing cost burdened 11,802 1,577 Households All Vacant housing Zone 8 (12,600 - 16,800 HDD) Interior Regional Housing Authority Coal NO PCE (gallons) Estimated Total Annual Community Space Heating Fuel Use 2008 -2011 33% 4% Propane Lack complete plumbing (cords) (tons)
Doyon BEES Climate Zone (Heating Degree Day Range) Weatherization Retrofits (funding increased 2008) Date Range
ANCSA Region: Regional Housing Authority: Houses Lacking Complete Plumbing or Kitchen Facilities Avg Annual Energy Cost without PCE COMMUNITY - Fairbanks North Star Borough 1 Star Homes Lack complete kitchen $8,106 Fuel Oil 2,111 Number of Units 41,191 5,608 35,583 Overcrowded 2003-2007 All Occupied Housing Natural Gas Electricity Wood (ccf) (kWh) (gallons) Avg Annual Energy Cost with PCE Housing Stock Estimates All Housing 44,747,712 1,160,734 35,946,033 27,387 162,670 922 Number
Vacant Housing for Sale or Rent 1990-2002 Housing Need Indicators % Occupied Housing 5%
30,618 53,983 77,720 82,840 97,581
CEN
444 791 3,749 4,020 10,934 10,596 4,626 6,031
MIX ACS
ARIS
OVERCROWDING & VENTILATION - Fairbanks North Star Borough Renter-occupied: 14,504 Owner-occupied: 21,079 Vacant, for sale: 534 Vacant, for rent: 1577 Vacant, recreational: 1759 Other Vacant: 1,737
Overcrowded: 1,090 Severely
Occupied, Not
33,966
MIX ARIS ARIS ACS
% Low Risk % High Risk ARIS
ARIS
DHW Appliances 11,073 3-star 1,844 26 31 143 $4.76 95 2-star 1,846 20 30 182 $6.03 230 2-star 1,488 22 28 168 $5.68 802 2-star plus 1,637 25 29 173 $5.75 1,013 2-star plus 1,836 27 30 161 $5.26 2,839 2-star plus 1,948 26 31 152 $5.02 3,344 3-star plus 1,743 25 31 140 $4.66 1,162 4-star 2,091 26 30 120 $4.06 1,456 4-star 1,801 26 31 113 $3.95 1,556 4-star plus 1,848 26 33 104 $3.65 # of AkWarm Records ACH 50 Ceiling R Door U Garage Door U Window U 11,073 5.6 31 0.31 0.26 0.47 95 12.0 21 0.42 0.25 0.57 230 10.1 23 0.37 0.25 0.55 802 8.9 24 0.35 0.30 0.53 1,013 7.1 26 0.36 0.31 0.53 2,839 6.7 28 0.33 0.30 0.53 3,344 4.8 34 0.29 0.27 0.44 1,162 3.5 38 0.27 0.20 0.40 1,456 3.5 39 0.26 0.17 0.37 1,556 2.8 42 0.24 0.17 0.31 7.0 38 0.22 0.22 0.22 4.0 48 0.22 0.22 0.22 9.1 59.7 1950- 59 4 15 15 38 15 9.8 5 17 13 28 5 15 34 BEES 2012 - Climate Zone 8 30 15 84.6 $6,252 2000- 2004 Current Fairbanks North Star Borough Housing Envelope Characteristics By Decade Built 301 $7,623 229 10.8 Current Fairbanks North Star Borough Housing Energy Characteristics By Decade Built 1940- 49 Avg Ann Energy by End Use (million Btus) Space Heating ENERGY - Fairbanks North Star Borough Current Residential Units by Year Built 6.2 167 136 $8,995 7 24 3 193 181 7.4 Below Grade Floor R 4 2 3 3 Above Grade Wall R 232 123 $7,651 Above Grade Floor R 14 3 3 25 3 19 30 12 30 38 15 18 7 278 8.5 221 2000- 2004 3 3 81.9 $6,604 2005 or later 1960- 69 2005 or later 1980- 89 1980- 89 75.7 2 OVERALL 72.1 $8,106 247 281 251 179 67.7 1970- 79 7.7 Avg Energy Rating Points Current Residential Units by Year Built 60.4 Pre- 1940 53.0 $8,661 267 188 Below Grade Wall R 5.6 5.0 1990- 99 79.9 $7,884 238 9.4 1960- 69 64.7 $9,022 213 224 176
Energy Cost
Energy Use (million BTUs)
(kBTUS /SF) Avg Sq. Feet
($ / SF)
Heating Index Avg Energy Rating Stars # of AkWarm Records $9,735 18 9 3 18 3 3 On Grade Floor R Pre- 1940 12 3 20 1950- 59 OVERALL 16 7 25 12 3 4 20 BEES 2009 - Climate Zone 8 1990- 99 1970- 79 14 3 3 1940- 49 13 4 20 13
ARIS Fuel Oil 88% Nat gas 2% Electricity 2% Wood 8% Propane 0.2%
ARIS
Monthly $ 1,256 $ 1,105 $ 1,445 $ 1,853 $ 571 Median Annual Household Income Housing Units Household Income Annual Avg % of Median Income Spent on Energy
46,898 $ 13,260 $ 88,845 $ Gross rent 2.6 68,922 $ All-occupied 2.4 2.7 All-occupied Renter-occupied 17,340 $ 6,852 $ Median Housing Costs AFFORDABILITY - Fairbanks North Star Borough Median Value of Owner-occupied House with Mortgage Renter-occupied 73,144 $ Owner-occupied w/ mortgage Owner-occupied Housing units w/ mortgage Housing units w/out a mortgage Owner-occupied All-occupied Avg Household Size (# of people) Housing Information Median Value of Owner-occupied House without a Mortgage 15,072 $ 93,453 $ $221,500 $185,100 w/o mortgage 22,236 $
2000 4000 6000 8000 10000 12000 14000 Overall With Mortgage W/o Mortgage Rental
# with costs 30.0 - 34.9% # with costs 35% or more MIX ACS ACS