
Slide 1 / 185 Slide 2 / 185
www.njctl.org 2014-10-30
7th Grade Math Probability
Slide 3 / 185
PROBABILITY
· Introduction to Probability · Experimental and Theoretical · Word Problems · Probability of Compound Events
Click on a topic to go to that section.
Common Core: 7.SP.1-8
· Sampling · Measures of Center · Measures of Variation · Mean Absolute Deviation · Glossary
Slide 4 / 185
Sometimes when you subtract the fractions, you find that you can't because the first numerator is smaller than the second! When this happens, you need to regroup from the whole number. How many thirds are in 1 whole? How many fifths are in 1 whole? How many ninths are in 1 whole?
Vocabulary words are identified with a dotted underline.
The underline is linked to the glossary at the end of the
- Notebook. It can also be printed for a word wall.
(Click on the dotted underline.)
Slide 5 / 185
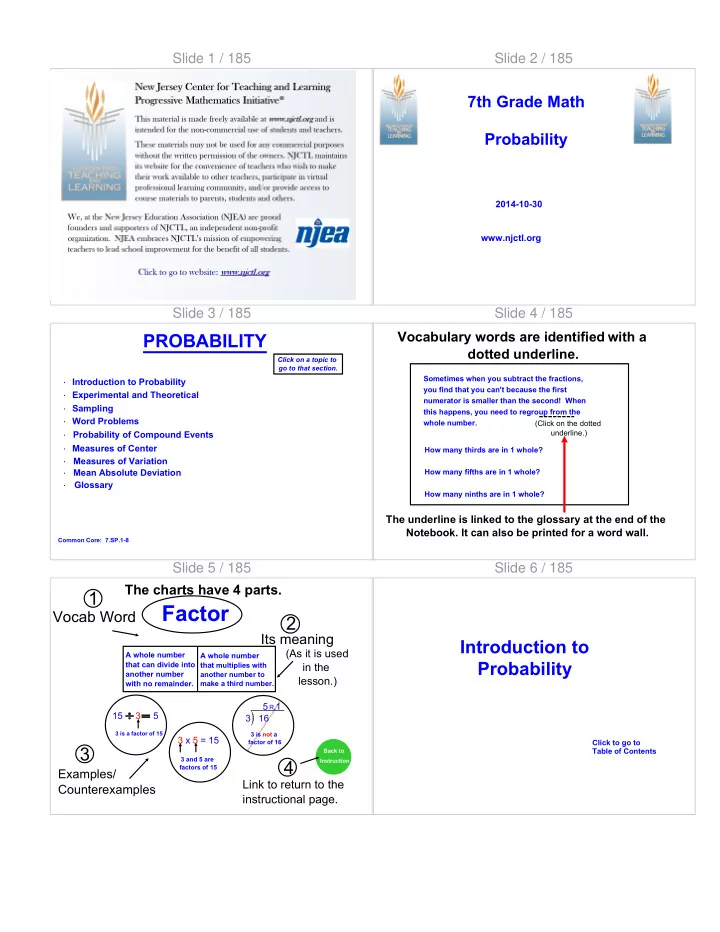
Back to Instruction
Factor
A whole number that can divide into another number with no remainder.
15 3 5
3 is a factor of 15
3 x 5 = 15
3 and 5 are factors of 15
16 3 5 .1
R 3 is not a factor of 16
A whole number that multiplies with another number to make a third number.
The charts have 4 parts.
Vocab Word
1
Its meaning
2
Examples/ Counterexamples
3
Link to return to the instructional page.
4
(As it is used in the lesson.)
Slide 6 / 185
Introduction to Probability
Click to go to Table of Contents