
SLIDE 1
CS 376 Spring 2018 - Lecture 3 1/25/2018 1
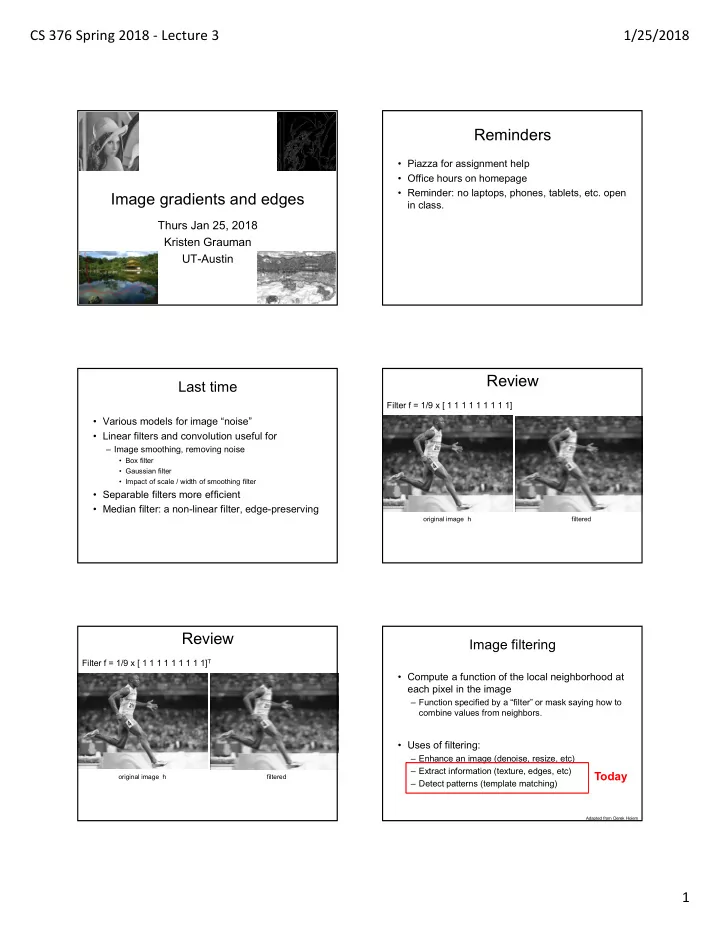
Image gradients and edges
Thurs Jan 25, 2018 Kristen Grauman UT-Austin
Reminders
- Piazza for assignment help
- Office hours on homepage
- Reminder: no laptops, phones, tablets, etc. open
in class.
Last time
- Various models for image “noise”
- Linear filters and convolution useful for
– Image smoothing, removing noise
- Box filter
- Gaussian filter
- Impact of scale / width of smoothing filter
- Separable filters more efficient
- Median filter: a non-linear filter, edge-preserving
f*g=?
- riginal image h
filtered
Filter f = 1/9 x [ 1 1 1 1 1 1 1 1 1]
Review
f*g=?
Filter f = 1/9 x [ 1 1 1 1 1 1 1 1 1]T
- riginal image h
filtered
Review
Image filtering
- Compute a function of the local neighborhood at
each pixel in the image
– Function specified by a “filter” or mask saying how to combine values from neighbors.
- Uses of filtering:
– Enhance an image (denoise, resize, etc) – Extract information (texture, edges, etc) – Detect patterns (template matching)
Adapted from Derek Hoiem
Today