F ARM P ROGRAM R EVIEW : ARC-CO Corn-Christian County, IL - - PDF document

f arm p rogram r eview arc co
SMART_READER_LITE
LIVE PREVIEW

F ARM P ROGRAM R EVIEW : ARC-CO Corn-Christian County, IL - - PDF document

F ARM P OLICY R EVIEW & O UTLOOK FOR 2018 F ARM B ILL Jonathan Coppess Gardner Agricultural Policy Program December 2017 w w w .farm docdaily.illinois.edu w w w .farm doc.illinois.edu 2014 F ARM P ROGRAM E LECTION Figure 1. Percent of


slide-1
SLIDE 1

w w w .farm docdaily.illinois.edu w w w .farm doc.illinois.edu

FARM POLICY REVIEW & OUTLOOK FOR 2018 FARM BILL

Jonathan Coppess

Gardner Agricultural Policy Program December 2017

2014 FARM PROGRAM ELECTION

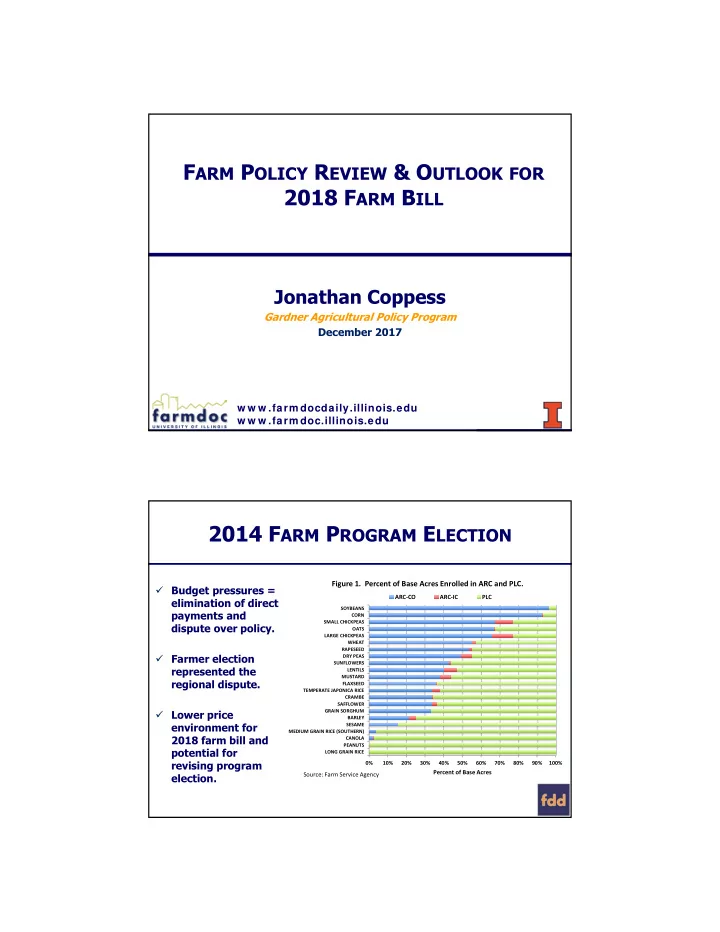
 Budget pressures = elimination of direct payments and dispute over policy.  Farmer election represented the regional dispute.  Lower price environment for 2018 farm bill and potential for revising program election.

0% 10% 20% 30% 40% 50% 60% 70% 80% 90% 100% LONG GRAIN RICE PEANUTS CANOLA MEDIUM GRAIN RICE (SOUTHERN) SESAME BARLEY GRAIN SORGHUM SAFFLOWER CRAMBE TEMPERATE JAPONICA RICE FLAXSEED MUSTARD LENTILS SUNFLOWERS DRY PEAS RAPESEED WHEAT LARGE CHICKPEAS OATS SMALL CHICKPEAS CORN SOYBEANS

Percent of Base Acres

Figure 1. Percent of Base Acres Enrolled in ARC and PLC.

ARC‐CO ARC‐IC PLC Source: Farm Service Agency

slide-2
SLIDE 2

FARM PROGRAM REVIEW: ARC-CO

50 100 150 200 250 $1.00 $2.00 $3.00 $4.00 $5.00 $6.00 $7.00 2009201020112012201320142015201620172018

Corn-Christian County, IL

MYA Price Reference Price Benchmark Price County Yield Benchmark Yield

  • Benchmark = 5-year

Olympic average price & yield (drop high and low).

  • Guarantee from 86% to

76% of benchmark.

  • Payments on 85% of base.
  • Key feature is the

adjustment of price & yield components.

FARM PROGRAM REVIEW: PLC

  • 2014 Farm Bill

raised reference prices; deficiencies paid on 85% of base.

  • Not all reference

prices are the same; lack of transparency and equity.

  • Peanut price trigger

(not shown) has averaged 120% of MYA since 2002.

$0.00 $0.10 $0.20 $0.30 $0.40 $0.50 $0.60 $0.70 $0.80 $0.90 $1.00 $0.00 $2.00 $4.00 $6.00 $8.00 $10.00 $12.00 $14.00 $16.00

$ per pound cotton $ per Bushel

Prices (MYA-NASS; CBO forecasts)

Corn Soybeans Wheat Corn Fixed (eff.) Soybeans Fixed (eff.) Wheat Fixed (eff.) Cotton Cotton Fixed (eff.)

slide-3
SLIDE 3

FARM PROGRAM REVIEW

  • ARC-CO has

averaged $36.17 per base acre.

  • PLC has averaged

$29 per base acre.

  • Under current

price scenarios, ARC unlikely to trigger payments; PLC likely to.

$0.00 $10.00 $20.00 $30.00 $40.00 $50.00 $60.00 $70.00 $80.00 2014 2015 2016 2017 2018

Program Payments-Christian Co.

ARC-CO PLC

OVERVIEW OF CROP INSURANCE

$0 $2,000 $4,000 $6,000 $8,000 $10,000 $12,000 $14,000 $16,000 $18,000 $20,000

Crop Insurance ($Millions)

Premium Subsidy Total Premium Indemnity Farmer Paid

  • 2017 total

liability was

  • ver $100b.
  • Over 1m

policies covering almost 300m acres insured.

  • Loss ratio

0.28.

slide-4
SLIDE 4

FARM BILL CONSERVATION TITLE

Reserve or Retirement

  • CRP (1985): 10-15 year rental to reserve from production
  • ACEP (1990): Easement purchased on land; wetlands, grasslands; farmland

Working Lands

  • EQIP (1996): cost-share assistance for practices; meet or avoid regulation
  • CSP (2002): 5-year contracts for maintaining and improving conservation
  • RCPP (2014): works across programs; regional basis; private funding match

Compliance (1985)

  • Determines eligibility for Federal assistance, including premium subsidy
  • Highly Erodible Land w/ plan; no converting or farming on converted wetlands
  • Significance: added in Eighties crisis; crop insurance removed 1996; reattached

2014

SEVEN ISSUES FOR THE NEXT FARM BILL

Outlook 2018.

slide-5
SLIDE 5

ISSUE #1: CBO BASELINE

$0 $5,000 $10,000 $15,000 $20,000 $25,000 2018 2019 2020 2021 2022 2023 2024 2025 2026 2027

Millions

CBO June 2017 Baseline

Crop Insurance Conservation Total Title 1

 Budget rules create “zero sum” effort  Increases in baseline for program or title requires offsets elsewhere in the baseline (program, crop or title).  CBO estimates spending for 10 years based on existing policy.

ISSUE #2: CROP INSURANCE

  • At roughly $6b per

year, premium discount is a target.

  • Admin./Heritage:

save over $30b by capping discount, eliminating harvest price, AGI.

  • Flake-Shaheen, save

$24b from harvest price, rate of return and capping premium subsidies/AGI.

$750k AGI passed Senate 2012 and 2013 (66 and 59 votes, respectively) House narrowly defeated crop insurance reform amendment 2013 (208 to 217)

slide-6
SLIDE 6

ISSUE #3: REVISING ARC

  • Yield fixes:

trend yield instead of 5-year Olympic; use RMA yields.

  • Price fixes:

different moving average prices (3-year; 10- year).

  • Higher

guarantee (e.g. 90%) and bigger coverage band (e.g. 15-20%).

$1.00 $2.00 $3.00 $4.00 $5.00 $6.00 $7.00

Corn Prices

MYA 5YOMA 10 Yr Avg 3 Yr Avg Reference

ARC & PLC IN THE BASELINE

$0.00 $1,000.00 $2,000.00 $3,000.00 $4,000.00 $5,000.00 $6,000.00 $7,000.00 $8,000.00 $9,000.00 2018 2019 2020 2021 2022 2023 2024 2025 2026 2027 Outlays: CBO, June 2017 Baseline ($ millions) PLC ARC-CO Crop Insurance Conservation Total Title 1

  • Notable shift

in Title I baseline from ARC to PLC.

  • CBO assumes

82% of corn base takes PLC; low ARC payments.

slide-7
SLIDE 7

ISSUE #4: COTTONSEED & DAIRY

  • Cotton removed in 2014

because of WTO dispute with Brazil.

  • Demand that cottonseed be

added to list of covered commodities at $15.00 cwt. ($0.15/lb.).

  • Potentially $5.4 billion in

baseline cost; what gets cut (corn, crop insurance, conservation, all of the above)?

  • Dairy: seeking fixes to

Margin Protection Program; feed cost calculation; premium; cost unknown.

ISSUE #5: CRP AND CONSERVATION

 2014 Farm Bill reduced acreage cap to 24 million acres.  Lower prices have increased interest in an increase to cap; wildlife and hunting interests are pushing.  Previous high was from 2002 Farm Bill at 39.2m; Concerns about baseline and offset issues; impact

  • n working lands

programs.  Problems with increasing rental rates in some areas competing with cash rents in low price environment. $0.00 $10.00 $20.00 $30.00 $40.00 $50.00 $60.00 $70.00 $80.00 5 10 15 20 25 30 35 40 45 50

$ per Acre, national average Million Acres Under Contract

CRP Statistics (USDA-FSA)

CRP Acres Farm Bills Acreage Cap Rental Rate

slide-8
SLIDE 8

ISSUE #6: SNAP

  • Substantial increase

in nutrition assistance particularly since 2008 recession; increases political pressure.

  • Recent hearings raise

concerns about error rates, fraud, etc.

  • Signal another

partisan SNAP fight?

  • Congressional

challenges in general, will this make it worse?

SNAP: HISTORICAL BACKGROUND

$0.00 $10,000.00 $20,000.00 $30,000.00 $40,000.00 $50,000.00 $60,000.00 $70,000.00 $80,000.00 $90,000.00 10,000 20,000 30,000 40,000 50,000 60,000 1969 1973 1977 1981 1985 1989 1993 1997 2001 2005 2009 2013 2017p 2021p 2025p Participants (thousands) Total Costs ($Millions)

Source: USDA; CBO (projections)

  • Helped farm programs in 1964; added

to farm bill in 1973; spending is on food, which benefits farmers.

  • Controversial amendment in 2013 and

farm bill defeat in House (195 to 234).

  • Strongest opponents of SNAP tend to
  • ppose farm programs and crop

insurance.

slide-9
SLIDE 9

ISSUE #7: TAX & DEFICIT.

  • $200.00

$0.00 $200.00 $400.00 $600.00 $800.00 $1,000.00 $1,200.00 $1,400.00 $1,600.00

Billions

Deficits & Tax Legislation (CBO)

Deficit Tax Bill PAYGO

  • Before the tax legislation,

CBO estimated debt would increase from $15.5 trillion to $25.5 trillion by 2027.

  • Statutory Pay-As-You-Go

(PAYGO) would require

  • ffsets for tax bill;

Congress would need to revise.

  • Note: 2018 PAYGO

estimate is $38 billion.

slide-10
SLIDE 10