
SLIDE 1
Slide 1 / 163 Slide 2 / 163
AP Calculus
Analyzing Functions Using Derivatives
2015-11-04 www.njctl.org
Slide 3 / 163 Table of Contents
Mean Value Theorem Connecting Graphs of f, f', and f''
click on the topic to go to that section
1st Derivative Test Concavity & 2nd Derivative Test Extreme Values - Graphically Curve Sketching Optimization Rolle's Theorem Newton's Method
Slide 4 / 163
Extreme Values: Graphically
Return to Table of Contents
Slide 5 / 163
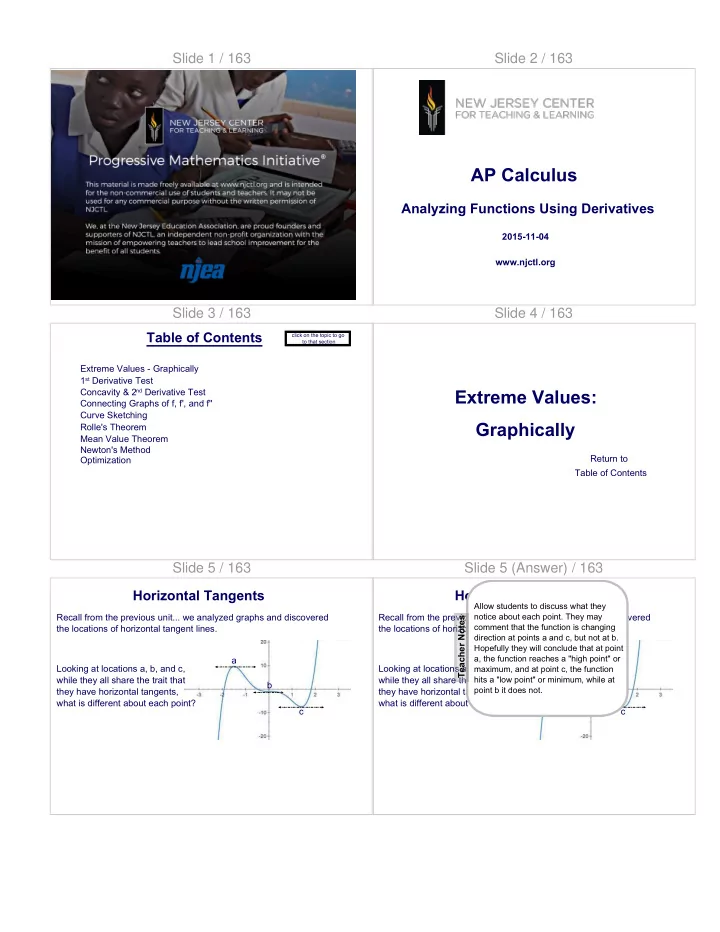
Recall from the previous unit... we analyzed graphs and discovered the locations of horizontal tangent lines. a b c Looking at locations a, b, and c, while they all share the trait that they have horizontal tangents, what is different about each point?
Horizontal Tangents Slide 5 (Answer) / 163
Recall from the previous unit... we analyzed graphs and discovered the locations of horizontal tangent lines. a b c Looking at locations a, b, and c, while they all share the trait that they have horizontal tangents, what is different about each point?
Horizontal Tangents
[This object is a pull tab]
Teacher Notes
Allow students to discuss what they notice about each point. They may comment that the function is changing direction at points a and c, but not at b. Hopefully they will conclude that at point a, the function reaches a "high point" or maximum, and at point c, the function hits a "low point" or minimum, while at point b it does not.