exploring the extremes of the underlying event
play

Exploring the extremes of the Underlying Event Peter Skands (Monash - PowerPoint PPT Presentation

Exploring the extremes of the Underlying Event Peter Skands (Monash U), with T. Martin & S. Farrington (Warwick U) pp 13000 GeV Strange things have been observed in ) MPI Number of parton-parton interactions Prob(n high-multiplicity


  1. Exploring the extremes of the Underlying Event Peter Skands (Monash U), with T. Martin & S. Farrington (Warwick U) pp 13000 GeV Strange things have been observed in ) MPI Number of parton-parton interactions Prob(n high-multiplicity minimum-bias events 1 ND UE ( p =20) Associated with small impact parameters <MB> T Z <UE> 1 − 10 tt Jet trigger → bias to small b (pedestal effect) Extreme UE ( → <UE> is larger than <MB>) − 2 10 Complementary studies can be carried out in UE. Fluctuates from event to event. 3 − 10 Studies as function of UE N ch (density) V I N C I A R O O T analogous to MB studies vs N ch (density) Pythia 8.227 Monash 2013 4 − 10 0 10 20 n MPI Based on Eur.Phys.J. C76 (2016) no.5, 299, arXiv:1603.05298 Collective effects in small collision systems CERN, June 2017
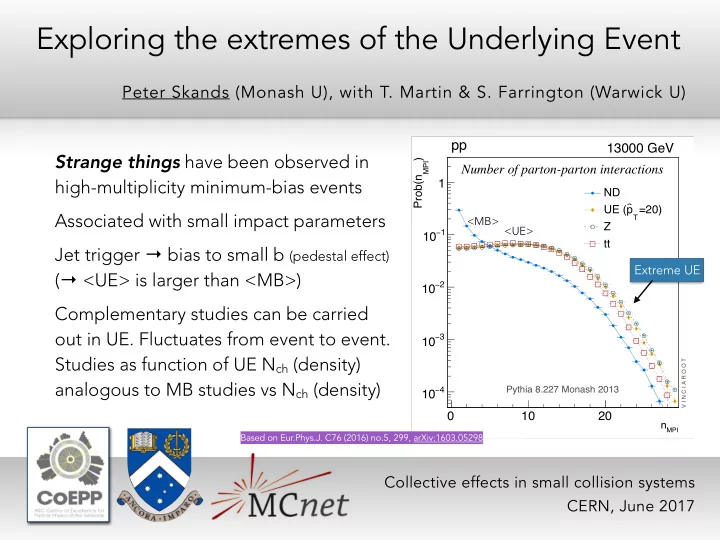
  2. MIN-BIAS VS THE UNDERLYING EVENT ๏ Tautology: a jet trigger provides a bias (ed subsample of min-bias) ๏ Pedestal effect: <MB> <UE> • Events with a hard jet trigger are accompanied by a higher plateau of ambient activity (extending far from the jet cores) • MPI: interpreted as a biasing effect. Small impact parameters → larger matter overlaps → more MPI → higher chances for a hard one (and the trigger throws out any events that didn’t have at least one) 2 Peter Skands Monash University

  3. DEFINING THE UNDERLYING EVENT ๏ Jet trigger (or other hard probe but want high statistics) • Consider event in transverse plane (x,y) Jet φ =0 - Δφ | Δφ |<60° + Δφ Towards Operational Look at 90 degrees to definition of UE Transverse 60°<| Δφ |<120° leading jet direction: = “Transverse Region” | Δφ |>120° Away Note: if your hard probe is a Z, you can also look in the “Towards” region If your hard probe is a ttbar pair, can (subtracting the decay leptons). do “Swiss Cheese” or jet median UE in Drell-Yan studies by ATLAS and approach (also generally applicable) Recoiling Jet CMS Cacciari, Salam, Sapeta, “On the characterisation of the underlying event,” JHEP 04(2010)065,arXiv:0912.4926 [hep-ph]. 3 Peter Skands Monash University

  4. THE (AVERAGE) UE ๏ By now lots of measurements of the average properties of the underlying event, and of its (non)-evolution * with p Ttrigger note: PHOJET does not describe the rise of the UE NB: trigger can be: Hardest track if you don’t have (good) calorimetry Hardest track-jet Hardest calo-jet more inclusive … *: radiation spillover into the UE does provide a (slow) evolution with p Ttrigger 4 Peter Skands Monash University

  5. FLUCTUATIONS OF THE UE ๏ ATLAS: UE fluctuates a lot from event to event mean level • (similarly to the large width of the N ch distribution in min-bias) Std Dev. Implies that there are “quiet” events with N TRNS << <N> Does the UE in those events look like min-bias? or LEP? Implies that there are “extreme UE” events with N TRNS >> <N> Does the UE in those events exhibit same effects as high-N ch min-bias? 5 Peter Skands Monash University

  6. STRANGENESS IN THE UE ๏ CMS: average strangeness (K0) as a function of trigger jet p T • 10% - 20% strangeness deficit also in UE (Ideally, should show ๏ strangeness fraction to avoid concluding that e.g., the PHOJET result is just due to strangeness; recall PHOJET was low on total N as well) Do extreme events have even larger deficits? What about quiet ones? What about other PIDs? 6 Peter Skands Monash University

  7. FLIPPING THE AXES ๏ Instead of plotting UE plateau as function of trigger jet p T , • ⇨ Plot salient quantities (e.g., strangeness) as function of event-by- event UE level, for some window of trigger jet p T Eur.Phys.J. C76 (2016) 5, 299, arXiv:1603.05298 We propose a window just 50 > [Trans.] Pythia 8.210 Monash 45 above the turn-on of the Pythia 8.210 Monash + New CR EPOS 1.3 LHC Study along this axis 40 plateau; maximises rates and DIPSY NoSwing 35 DIPSY Rope minimises contamination of Inc. 30 < N the UE by radiation 25 20 10 GeV < p Ttrigger < 30 GeV Window 15 10 5 s = 13 TeV Note: N inc is ATLAS jargon for a particular Monash 1.4 0 5 10 15 20 25 30 35 combination of charged tracks and long- 1.2 MC 1 lived strange hadrons that they can 0.8 reconstruct well. Think of it as N ch . 0.6 35 0 5 10 15 20 25 30 35 [GeV] Leading Track-Jet p [GeV] T 7 Peter Skands Monash University

  8. WHAT MIGHT YOU SEE? ๏ Bear in mind: models only represent a subset of the possibilities in nature Generator Tune h N Inc . i σ P YTHIA 8 Monash 24.7 12.5 Ev P YTHIA 8 Monash + New CR 25.5 12.6 Here is basically an 1 − 1/N 10 LHC 24.2 14.6 EPOS D IPSY NoSwing 21.3 12.2 D IPSY Rope 25.1 12.0 N ch spectrum 2 − 10 (but for the UE) 3 − 10 Pythia 8.210 Monash 4 − Pythia 8.210 Monash + New CR 10 EPOS 1.3 LHC Use average to define DIPSY NoSwing DIPSY Rope 5 − 10 AVERAGE UE LEVEL 10 Jet p < 30 GeV, s = 13 TeV ≤ T Monash 10 0 10 20 30 40 50 60 70 80 90 100 and R T = N / <N> MC 1 (analogous to the 0 10 20 30 40 50 60 70 80 90 100 KNO z variable) N [Trans.] Inc. 8 Peter Skands Monash University

  9. THEORY: UNDER THE HOOD Number of MPI Impact parameter (relative to average MB) Extreme UE 25 2 > > MPI MPI <n > vs R <b > vs R higher <b> than MPI T MPI T <n <b min-bias but Monash 13 Monash 13 20 have hard jets Average 4C 4C 1.5 4Cx 4Cx UE AU2-CT6L1 AU2-CT6L1 Quiet 15 <MB> UE 1 Quiet ~ MB 10 UE <UE> 0.5 V I N C I A R O O T V I N C I A R O O T 5 Extreme Pythia 8.216 Pythia 8.216 0 0 1.4 1.4 1.2 1.2 Ratio Ratio 1 1 0.8 0.8 0.6 0.6 1 0.5 0 0.5 1 0.5 0 0.5 − − − − log (R ) log (R ) T T 10 10 9 Peter Skands Monash University

  10. THE UE ANALOGUE OF <PT>(NCH) ๏ Rising trend in minimum-bias taken as indicative of collectivity; how about in UE? > [GeV][Trans.] RMS > [GeV][Trans.] 14 1.2 Pythia 8.210 Monash Pythia 8.210 Monash Pythia 8.210 Monash + New CR Pythia 8.210 Monash + New CR EPOS 1.3 LHC EPOS 1.3 LHC 12 1.1 DIPSY NoSwing DIPSY NoSwing DIPSY Rope DIPSY Rope 1 10 0.9 8 T 0.8 < mean p 6 0.7 T 4 < p 0.6 s = 13 TeV s = 13 TeV 2 Monash Monash 1.4 MC 1.2 MC 1.2 1 1 0.8 1 1 − − 2 10 1 2 3 4 2 10 1 2 3 4 × × R R T T <pT> RMS 10 Peter Skands Monash University

  11. STRANGENESS ! ๏ Significant power to separate different physics mechanisms (b) > [Trans.] ) > [Trans.] 0.18 0.058 Pythia 8.210 Monash Pythia 8.210 Monash Pythia 8.210 Monash + New CR Pythia 8.210 Monash + New CR EPOS 1.3 LHC EPOS 1.3 LHC 0.056 0.16 DIPSY NoSwing DIPSY NoSwing DIPSY Rope DIPSY Rope 0.054 0.14 Inc. S 0 )/N(K )/N 0.052 0.12 s = 13 TeV S 0 < N(K 0.05 φ < N( 0.1 s = 13 TeV 0.048 0.08 0.046 Monash Monash 1.1 2 MC MC 1 1.5 0.9 1 0.8 1 1 − − 2 10 2 3 4 2 10 2 3 4 1 1 × × R R T T Kaons Phi mesons (b) 11 Peter Skands Monash University

  12. IT’S EVEN MORE FUN WITH BARYONS 0.08 0.9 > [Trans.] ) > [Trans.] Pythia 8.210 Monash Pythia 8.210 Monash 0.075 Pythia 8.210 Monash + New CR Pythia 8.210 Monash + New CR 0.8 EPOS 1.3 LHC EPOS 1.3 LHC 0.07 DIPSY NoSwing DIPSY NoSwing DIPSY Rope DIPSY Rope 0.065 0.7 Inc. - K 0.06 )/N + )/N(K 0.6 0.055 p < N(p 0.05 p s = 13 TeV 0.5 < N(p 0.045 0.04 0.4 s = 13 TeV Monash Monash 1.6 1.4 MC MC 1.4 1.2 1.2 1 1 0.8 0.8 − 1 − 1 2 10 2 3 4 2 10 2 3 4 × 1 × 1 R R T T (a) (b) 0.7 ) > [Trans.] ) > [Trans.] 0.18 Pythia 8.210 Monash Pythia 8.210 Monash 0.65 Pythia 8.210 Monash + New CR Pythia 8.210 Monash + New CR EPOS 1.3 LHC EPOS 1.3 LHC 0.6 0.16 DIPSY NoSwing DIPSY NoSwing DIPSY Rope DIPSY Rope 0.55 0.14 S Λ 0 s = 13 TeV 0.5 )/N(K Λ )/N( 0.12 0.45 Λ + 0.4 Ξ Λ 0.1 - < N( Ξ s = 13 TeV 0.35 < N( 0.08 0.3 Monash Monash 2.5 MC MC 1.5 2 1.5 1 1 1 1 − − 2 10 1 2 3 4 2 10 1 2 3 4 × × R R T T 12 Peter Skands Monash University

  13. SUMMARY / OUTLOOK ๏ The UE provides a complementary phase-space region to min-bias which could well exhibit similar phenomena as high-mult min-bias • Hard trigger biases selection to small impact parameters But can find “ultra-quiet” UE levels with even less activity / higher b, than MB (LEP-like?) ๏ Can explore events with “extreme” UE levels → collectivity? ๏ • Models based on different principles predict qualitatively different trends for the various particle ratios, as functions of the UE level NB: so far, we only studied particle multiplicities ( ratios) and spectra; particle ๏ correlations would provide additional information ๏ Work is ongoing in ATLAS; but limited by PID capabilities • CMS similar? (but not aware of any measurement underway?) ๏ ALICE and LHCb have the PID to do it • What is the status of UE studies? Jet or hard-track triggers? Other hard trigger probes? ๏ 13 Peter Skands Monash University

  14. Backup Slides

Download Presentation
Download Policy: The content available on the website is offered to you 'AS IS' for your personal information and use only. It cannot be commercialized, licensed, or distributed on other websites without prior consent from the author. To download a presentation, simply click this link. If you encounter any difficulties during the download process, it's possible that the publisher has removed the file from their server.

Recommend


More recommend