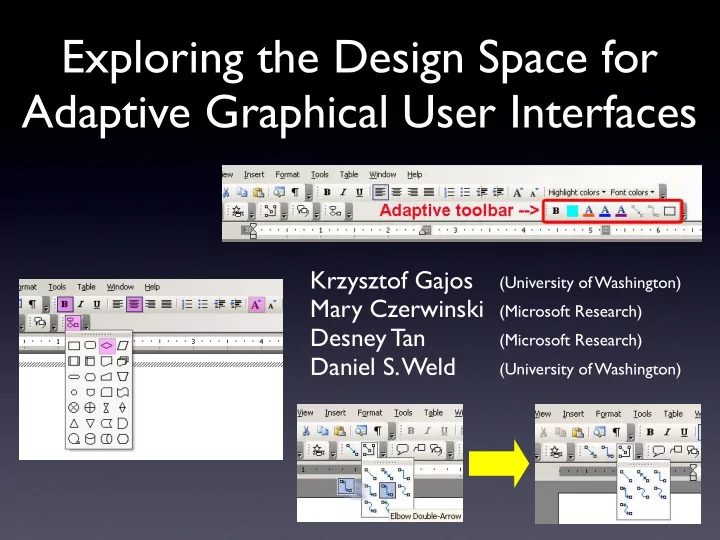
SLIDE 1 Exploring the Design Space for Adaptive Graphical User Interfaces
Krzysztof Gajos Mary Czerwinski Desney Tan Daniel S. Weld (University of Washington) (Microsoft Research) (Microsoft Research) (University of Washington)
SLIDE 2
Scope
Graphical User Interfaces where the system automatically adapts the presentation of the functionality
SLIDE 3
Scope
Graphical User Interfaces where the system automatically adapts the presentation of the functionality The Split Interface
SLIDE 4
Scope
Graphical User Interfaces where the system automatically adapts the presentation of the functionality The Moving Interface
SLIDE 5
Scope
Graphical User Interfaces where the system automatically adapts the presentation of the functionality The Visual Popout Interface
SLIDE 6
Scope
Graphical User Interfaces where the system automatically adapts the presentation of the functionality
SLIDE 7
Motivation
SLIDE 8
Motivation
SLIDE 9
Motivation
SLIDE 10
Motivation
They disorient the user!
SLIDE 11 Motivation
They disorient the user!
They optimize the UI for the individual!
SLIDE 12
Prior Work
SLIDE 13 Prior Work
↑ Greenberg and Witten [1985] ↕
Trevellyan and Browne [1987]
↓ Mitchell and Shneiderman [1989] ↑ Sears and Shneiderman [1994] ?
McGrenere, Baecker and Booth [2002]
↓ Findlater and McGrenere [2004] ↔ Tsandilas and shraefel [2005]
SLIDE 14
Commercial Deployments
SLIDE 15
Commercial Deployments
SLIDE 16
Our Goal
Uncover the factors and relationships that influence users’ satisfaction and actual performance when using adaptive UIs
SLIDE 17
Road Map
Introduce and motivate the problem Video Experiment 1: qualitative results Experiment 2: quantitative results Synthesis Conclusions
SLIDE 18
SLIDE 19
SLIDE 20 Potential Benefit Potential Disorientation
SLIDE 21 Potential Benefit Potential Disorientation
Medium Low
The Split Interface
SLIDE 22 Potential Benefit Potential Disorientation
Medium Low High Medium
The Split Interface The Moving Interface
SLIDE 23 Potential Benefit Potential Disorientation
Medium Low High Medium Low Low
The Split Interface The Moving Interface The Visual Popout Interface
SLIDE 24
Experiment 1
Goal: collect informative subjective data
SLIDE 25 Participants
- 26 volunteers (10 female)
- aged 25 to 55 (mean=46)
- moderate to high experience using computers (as
indicated by a validated screener)
- intermediate to expert users of MS Office (as
indicated by a validated screener)
- participants received software gratuity
SLIDE 26 Tasks
- Three classes of editing tasks:
- Flow chart edits
- Text edits
- Combined text and graphical edits
SLIDE 27
Procedures
SLIDE 28 Procedures
Training Start
SLIDE 29 Procedures
Training Start Flow Chart task Quotes task Poster task Questionnaire
SLIDE 30 Procedures
Training Start Flow Chart task Quotes task Poster task Questionnaire Done 4 conditions? Change Interface
SLIDE 31 Procedures
Training Start Flow Chart task Quotes task Poster task Questionnaire Done 4 conditions? Change Interface Final Questionnaire End
SLIDE 32
Results: Ranking
Users ranked the Split Interface the highest (p<0.001)
SLIDE 33
Results: Ranking
Users ranked the Split Interface the highest (p<0.001)
SLIDE 34 1 2 3 4 5 6 7
E a s e
U s e S a t i s f a c t i
Unchanging Split Moving Visual Popout
General Satisfaction
SLIDE 35 1 2 3 4 5 6 7
E a s e
U s e S a t i s f a c t i
Unchanging Split Moving Visual Popout
1 2 3 4 5 6 7
E a s e
U s e S a t i s f a c t i
Unchanging Split Moving Visual Popout
General Satisfaction
SLIDE 36 1 2 3 4 5 6 7
E a s e
U s e S a t i s f a c t i
Unchanging Split Moving Visual Popout
1 2 3 4 5 6 7
E a s e
U s e S a t i s f a c t i
Unchanging Split Moving Visual Popout
General Satisfaction
1 2 3 4 5 6 7
E a s e
U s e S a t i s f a c t i
Unchanging Split Moving Visual Popout
SLIDE 37 1 2 3 4 5 6 7
E a s e
U s e S a t i s f a c t i
Unchanging Split Moving Visual Popout
1 2 3 4 5 6 7
E a s e
U s e S a t i s f a c t i
Unchanging Split Moving Visual Popout
General Satisfaction
1 2 3 4 5 6 7
E a s e
U s e S a t i s f a c t i
Unchanging Split Moving Visual Popout
1 2 3 4 5 6 7
E a s e
U s e S a t i s f a c t i
Unchanging Split Moving Visual Popout
SLIDE 38 1 2 3 4 5 6 7
E a s e
U s e S a t i s f a c t i
Unchanging Split Moving Visual Popout
1 2 3 4 5 6 7
E a s e
U s e S a t i s f a c t i
Unchanging Split Moving Visual Popout
General Satisfaction
SLIDE 39 Usability
1 2 3 4 5 6 7
D i s c
e r a b i l i t y S e n s e
C
t r
P r e d i c t a b i l i t y
a d a p t a t i
Unchanging Split Moving Visual Popout
1 2 3 4 5 6 7
D i s c
e r a b i l i t y S e n s e
C
t r
P r e d i c t a b i l i t y
a d a p t a t i
Unchanging Split Moving Visual Popout
SLIDE 40 Usability
1 2 3 4 5 6 7
D i s c
e r a b i l i t y S e n s e
C
t r
P r e d i c t a b i l i t y
a d a p t a t i
Unchanging Split Moving Visual Popout
1 2 3 4 5 6 7
D i s c
e r a b i l i t y S e n s e
C
t r
P r e d i c t a b i l i t y
a d a p t a t i
Unchanging Split Moving Visual Popout
1 2 3 4 5 6 7
D i s c
e r a b i l i t y S e n s e
C
t r
P r e d i c t a b i l i t y
a d a p t a t i
Unchanging Split Moving Visual Popout
SLIDE 41
Subjective Cost and Benefit
SLIDE 42
based on:
- Mental demand
- Physical Demand
- Frustration
- Confusion due to
adaptation
Subjective Cost and Benefit
SLIDE 43
based on:
- Mental demand
- Physical Demand
- Frustration
- Confusion due to
adaptation
based on:
- Performance
- Efficiency due to
adaptation
Subjective Cost and Benefit
SLIDE 44
based on:
- Mental demand
- Physical Demand
- Frustration
- Confusion due to
adaptation
based on:
- Performance
- Efficiency due to
adaptation
Subjective Cost and Benefit
Subjective cost Subjective benefit
Non-adaptive baseline Visual Popout Interface Split Interface Moving Interface
SLIDE 45
based on:
- Mental demand
- Physical Demand
- Frustration
- Confusion due to
adaptation
based on:
- Performance
- Efficiency due to
adaptation
Subjective Cost and Benefit
Subjective cost Subjective benefit
Non-adaptive baseline Visual Popout Interface Split Interface Moving Interface
SLIDE 46
User Comments
Split Interface Moving Interface Visual Popout Interface
SLIDE 47 User Comments
Split Interface Moving Interface Visual Popout Interface
grouping
SLIDE 48 User Comments
Split Interface Moving Interface Visual Popout Interface
grouping
SLIDE 49 User Comments
Split Interface Moving Interface Visual Popout Interface
grouping
SLIDE 50 User Comments
Split Interface Moving Interface Visual Popout Interface
grouping
discoverability
SLIDE 51 User Comments
Split Interface Moving Interface Visual Popout Interface
grouping
discoverability
SLIDE 52 User Comments
Split Interface Moving Interface Visual Popout Interface
grouping
discoverability
- instability
- anti-salience
SLIDE 53
Road Map
Introduce and motivate the problem Video Experiment 1: qualitative results Experiment 2: quantitative results Synthesis Conclusions
SLIDE 54
Experiment 2
Investigate how the accuracy of the adaptive algorithm affects how adaptation is used Collect accurate performance data Goals:
SLIDE 55 Participants
- 8 research colleagues (2 female)
- aged 25 to 58 (mean=36)
- high experience using computers
- expert users of MS Office
- participants received two meal vouchers as
gratuity
SLIDE 56
Tasks
SLIDE 57
Tasks
SLIDE 58
Tasks
SLIDE 59
Tasks
SLIDE 60
Tasks
SLIDE 61 Procedures
- Introduction and a brief training on a non-
adaptive version of the interface
- Each participant used each of the three
interfaces (Unchanging, Split and Moving) at two different accuracy levels (30% and 70%)
SLIDE 62 Performance Vs. Adaptation Type
None Split Moving 70 75 80 85 90 95
Completion time (seconds)
SLIDE 63 Performance Vs. Adaptation Type
None Split Moving 70 75 80 85 90 95
Completion time (seconds)
SLIDE 64 Performance Vs. Adaptation Type
significantly faster using Split Interface than Non- adaptive baseline (p<0.003)
None Split Moving 70 75 80 85 90 95
Completion time (seconds)
SLIDE 65 Performance Vs. Adaptation Type
significantly faster using Split Interface than Non- adaptive baseline (p<0.003)
None Split Moving 70 75 80 85 90 95
Completion time (seconds)
SLIDE 66 Performance Vs. Adaptation Type
significantly faster using Split Interface than Non- adaptive baseline (p<0.003)
marginally faster using Moving Interface than Non-adaptive baseline (p<0.073)
None Split Moving 70 75 80 85 90 95
Completion time (seconds)
SLIDE 67 Performance Vs. Adaptation Type
significantly faster using Split Interface than Non- adaptive baseline (p<0.003)
marginally faster using Moving Interface than Non-adaptive baseline (p<0.073)
None Split Moving 70 75 80 85 90 95
Completion time (seconds)
SLIDE 68 Performance Vs. Accuracy
interfaces resulted in faster performance at the higher (70%) accuracy level than at the lower (30%) level (p<0.001)
70 75 80 85 90 95 Split Moving 30% 70% 30% 70%
SLIDE 69 Frequency of Use
SLIDE 70 Frequency of Use
SLIDE 71 Frequency of Use
?
SLIDE 72 Frequency of Use
19% 81% 30% accuracy
SLIDE 73 Frequency of Use
7% 93% 70% accuracy 19% 81% 30% accuracy
SLIDE 74
User Comments
Split Interface Moving Interface
SLIDE 75 User Comments
Split Interface Moving Interface
SLIDE 76 User Comments
Split Interface Moving Interface
- discoverability
- poor discoverability
SLIDE 77 User Comments
Split Interface Moving Interface
- discoverability
- poor discoverability
- instability
SLIDE 78
Exploring the Design Space for Adaptive Graphical User Interfaces
SLIDE 79
Exploring the Design Space for Adaptive Graphical User Interfaces
SLIDE 80
Putting It All Together
SLIDE 81
Putting It All Together
Interaction Mechanics stability locality
SLIDE 82
Putting It All Together
Algorithm Behavior frequency of adaptation accuracy predictability Interaction Mechanics stability locality
SLIDE 83
Putting It All Together
Context interaction frequency task complexity Algorithm Behavior frequency of adaptation accuracy predictability Interaction Mechanics stability locality
SLIDE 84 Context interaction frequency task complexity Algorithm Behavior frequency of adaptation accuracy predictability Interaction Mechanics stability locality
Stability
Split Interfaces Moving Interface High stability Low stability User satisfaction
SLIDE 85 Context interaction frequency task complexity Algorithm Behavior frequency of adaptation accuracy predictability Interaction Mechanics stability locality
Stability
Split Interfaces Moving Interface MS Smart Menus High stability Low stability User satisfaction
SLIDE 86 Context interaction frequency task complexity Algorithm Behavior frequency of adaptation accuracy predictability Interaction Mechanics stability locality
Stability
Split Interfaces Moving Interface MS Smart Menus Visual Popout High stability Low stability User satisfaction
SLIDE 87 Locality
- User comments indicate that, especially for
manual tasks, high locality improves discoverability of adaptation.
Context interaction frequency task complexity Algorithm Behavior frequency of adaptation accuracy predictability Interaction Mechanics stability locality
SLIDE 88 Context interaction frequency task complexity Algorithm Behavior frequency of adaptation accuracy predictability Interaction Mechanics stability locality
Adaptation Frequency
↑ Sears and Shneiderman [1994] ↓ Findlater and McGrenere [2004]
Two studies of Split Menus:
SLIDE 89 Context interaction frequency task complexity Algorithm Behavior frequency of adaptation accuracy predictability Interaction Mechanics stability locality
Adaptation Frequency
↑ Sears and Shneiderman [1994] ↓ Findlater and McGrenere [2004]
adaptation once per user/session adaptation once per interaction Two studies of Split Menus:
SLIDE 90 Context interaction frequency task complexity Algorithm Behavior frequency of adaptation accuracy predictability Interaction Mechanics stability locality
Accuracy
SLIDE 91 Context interaction frequency task complexity Algorithm Behavior frequency of adaptation accuracy predictability Interaction Mechanics stability locality
Accuracy
- Participants performed faster at higher accuracy
levels
(also in [ Tsandilas and schraefel CHI’05])
SLIDE 92 Context interaction frequency task complexity Algorithm Behavior frequency of adaptation accuracy predictability Interaction Mechanics stability locality
Accuracy
- Participants performed faster at higher accuracy
levels
(also in [ Tsandilas and schraefel CHI’05])
- Participants were more likely to take advantage
- f adaptation at higher accuracy levels
SLIDE 93 Context interaction frequency task complexity Algorithm Behavior frequency of adaptation accuracy predictability Interaction Mechanics stability locality
Accuracy
- Participants performed faster at higher accuracy
levels
(also in [ Tsandilas and schraefel CHI’05])
- Participants were more likely to take advantage
- f adaptation at higher accuracy levels
- More disorienting interfaces affected more by
reduced accuracy
[ Tsandilas and schraefel CHI’05]
SLIDE 94 Predictability
A study in progress!
Context interaction frequency task complexity Algorithm Behavior frequency of adaptation accuracy predictability Interaction Mechanics stability locality
SLIDE 95 Context interaction frequency task complexity Algorithm Behavior frequency of adaptation accuracy predictability Interaction Mechanics stability locality
Interaction Frequency
↑ Greenberg and Witten [1985] ↕ Trevellyan and Browne [1987]
Two studies of adaptive deep hierarchical menus:
SLIDE 96 Context interaction frequency task complexity Algorithm Behavior frequency of adaptation accuracy predictability Interaction Mechanics stability locality
Interaction Frequency
↑ Greenberg and Witten [1985] ↕ Trevellyan and Browne [1987]
30 interactions per trial 100 interactions per trial:
- - first 30 positive
- - last 30 neutral or negative
Two studies of adaptive deep hierarchical menus:
SLIDE 97 Task Complexity
Split Interface Moving Interface
grouping
discoverability
Split Interface Moving Interface
discoverability
Experiment 1 Experiment 2
Context interaction frequency task complexity Algorithm Behavior frequency of adaptation accuracy predictability Interaction Mechanics stability locality
SLIDE 98 Task Complexity
Split Interface Moving Interface
grouping
discoverability
Split Interface Moving Interface
discoverability
Experiment 1 Experiment 2
Context interaction frequency task complexity Algorithm Behavior frequency of adaptation accuracy predictability Interaction Mechanics stability locality
SLIDE 99
Conclusions
SLIDE 100
Conclusions
Moving Interface Split Interface Visual Popout
SLIDE 101
Conclusions
Moving Interface Split Interface Visual Popout Preferred Disliked [Experiment 1]
SLIDE 102
Conclusions
Moving Interface Split Interface Visual Popout Preferred Disliked Faster [Experiment 2]
SLIDE 103
Conclusions
Context interaction frequency task complexity Algorithm Behavior frequency of adaptation accuracy predictability Interaction Mechanics stability locality
SLIDE 104 Acknowledgments
- Andrea Bunt, Leah Findlater and Joanna
McGrenere at UBC
VIBE Group at MSR
SLIDE 105 Contact Information
kgajos@cs.washington.edu
marycz@microsoft.com
desney@microsoft.com
weld@cs.washington.edu