
SLIDE 1
Explaining drying of free water by percolation theory
Jarl-Gunnar Salin
SP Technical Research Institute of Sweden SP Wood Technology Stockholm, Sweden
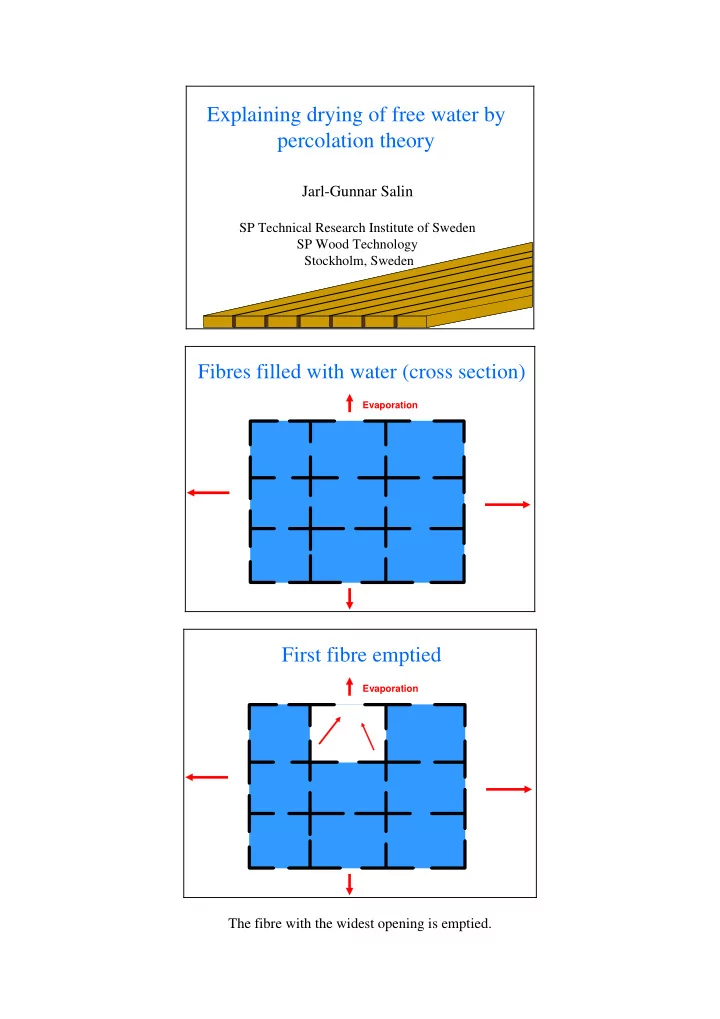
Fibres filled with water (cross section)
Evaporation
First fibre emptied
Evaporation