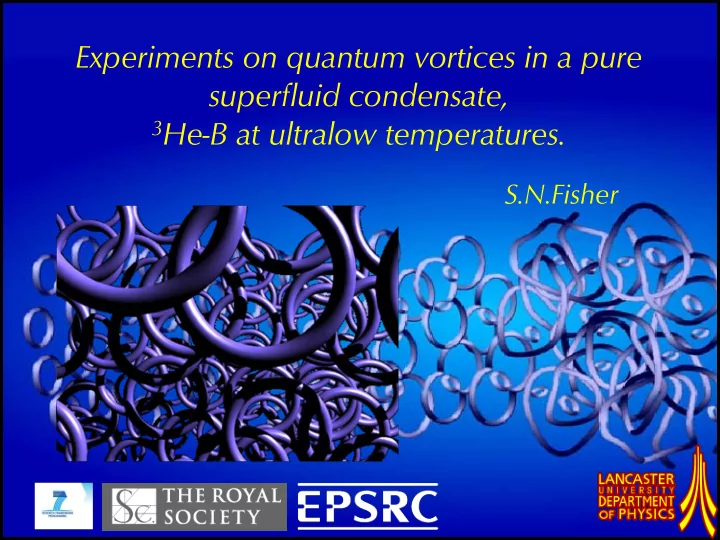
SLIDE 1
Experiments on quantum vortices in a pure superfluid condensate,
3He-B at ultralow temperatures.
S.N.Fisher
SLIDE 2
Lancaster Quantum Fluids Ian Bradley Pam Crookston Viktor Efimov Matt Fear Shaun Fisher George Foulds Deepak Garg Mark Giltrow Andrei Ganshyn Tony Guénault Richard Haley Matthew Holmes Martin Jackson Oleg Kolosov Chris Lawson Peter McClintock Ian Miller Alan Stokes Samantha O’Sullivan Roch Schanen David Potts George Pickett Viktor Tsepelin Nikolai Vasilev Martin Ward Paul Williams Louise Wheatland Peter Skyba (Kosice) Joe Vinen (Birmingham)
SLIDE 3
~1 in 104000 @ T~80μK
SLIDE 4 Quantum Vortices (3He-B and 4He)
core size:
4He : ξ0 ~ 0.1 nm 3He : ξ0 ~ 65 - 15 nm (pressure dep.)
2π phase change around core Gives circulating superfluid flow,
vS = κ/2πr
circulation :
κ4 = h/m4 κ3 = h/2m3
Classical Vortices (eddies)
can have a wide range of shapes and sizes.
SLIDE 5
Vortices can end on cell walls Form self propagating Rings Or form a tangle (Quantum Turbulence)
Leonardo da Vinci 1515 d~5μm ⇒ u~10mm s-1 Inter-vortex spacing l Line Density L=1/l2 (line length per unit volume)
SLIDE 6
Vortices produced by a rapid phase transition
SLIDE 7
Cosmological Analogue: Phase Transitions after the Big Bang
Maybe Cosmic Stings produced here ? (Kibble Mechanism)
SLIDE 8
neutron
n + 3He p + 3H + 764keV
The “Big Bang”
SLIDE 9
Hot Expanding Universe
(normal 3He)
SLIDE 10
The Phase Transition
(to superfluid 3He)
SLIDE 11
Ordering produces domains, limited by causality (fast transition gives small domains)
SLIDE 12
The order parameter smoothes, leaving defects (Cosmic strings / vortices)
SLIDE 13
Line defects form a random tangle
(Quantum Turbulence)
SLIDE 14
The tangle may evolve very slowly (and may store a lot of energy)
SLIDE 15
The detector is calibrated (using the heater wire to input a known energy) which then allows us to determine the energies of individual events.
6.5 6.0 5.5 5.0 4.5 Thermometer damping (Hz) 13:00 13:15 13:30 13:45 14:00 Time (hours:mins) The damping of the thermometer wire in the box with an external neutron source.
SLIDE 16
Good agreement with the `Cosmological’ model (Kibble-Zurek mechanism) Energy deficit measures the amount of vortices produced
SLIDE 17
Vortices produced by annihilation of phase boundaries
(analogous to Brane-collisions in cosmology, which may have triggered inflation)
SLIDE 18
SLIDE 19
SLIDE 20
SLIDE 21
SLIDE 22
First with B-phase only (with a magnetic field JUST below what is needed to create the A-phase slice.)
SLIDE 23
Now with the A-phase slice present Extra impedance from the A-phase and AB-BA phase boundaries
SLIDE 24 After annihilation, we do NOT go back to the
SLIDE 25
SLIDE 26
Vortex Production by a vibrating Grid in 3He-B Intrinsic damping (approx. linear) `Turbulent’ damping F∝ v2
SLIDE 27
The excitation dispersion curve is tilted by superflow (energies are shifted by pF.v). Liquid static Liquid moving
SLIDE 28
~10μm
Andreev Scattering by vortex lines
The flow around a vortex, Andreev reflects excitations (particles on one side and holes on the other side).
SLIDE 29
Vibrating Wire Resonator
a loop of superconducting wire is placed in a magnetic field and set into motion by passing an ac current through it .
SLIDE 30
B
Vibrating Wire Resonator
a loop of superconducting wire is placed in a magnetic field and set into motion by passing an ac current through it .
Vo exp(iωt) Io exp(iωt)
Damped by Quasiparticles
SLIDE 31
B
Vibrating Wire Resonator
a loop of superconducting wire is placed in a magnetic field and set into motion by passing an ac current through it .
Vo exp(iωt) Io exp(iωt)
Quasiparticle damping reduced by surrounding vortices
SLIDE 32
The wire damping is suppressed when the grid is oscillated. This is our `vortex signal’.
SLIDE 33
Note the noisy signal – we see fluctuations in the vortex configuration.
SLIDE 34 First, focus on the decay
we switch off the grid.
SLIDE 35
SLIDE 36
SLIDE 37
Based on simulations by Makoto Tsubota’s group. The grid frequency, 1300Hz, predominantly excites 5μm diameter loops.
SLIDE 38
Simulations by Makoto Tsubota’s group. At low ring production rates, the rings are ballistic and travel with their self-induced velocity with almost no interaction.
SLIDE 39
Simulations by Makoto Tsubota’s group. At higher ring production rates, the rings collide to produce a vortex tangle (quantum turbulence).
SLIDE 40
Simulations by Makoto Tsubota’s group. The quantum turbulence then decays relatively slowly.
SLIDE 41 Arrows give ange of 5 micron rings based on mutual friction measurements by Bevan et. al. JLTP 109, 243 (1997).
SLIDE 42
Decay of Pure Quantum Turbulence
SLIDE 43
Richardson cascade - Kolmogorov spectrum
E(k)=Cε2/3 k -5/3
D
Viscous Dissipation UR/ν~1
Classical cascade model (assuming ω=κL) predicts: Vortex Line Density at late times, L=D/2πκ (27C/ν)1/2 t-3/2 ν = `effective’ kinematic viscosity. Reynolds Number, Re=UR/ν >> 1
SLIDE 44
Decay of Pure Quantum Turbulence
SLIDE 45
Turbulent Fluctuations
SLIDE 46
Power spectrum of turbulent fluctuations
SLIDE 47
Power spectrum of turbulent fluctuations
SLIDE 48 Cross-correlation of turbulent fluctuations
Peak at Δt ∼ − 2s, suggests the tangle has a net outward velocity
SLIDE 49
Turbulent fluctuations observed in the most recent experiment
SLIDE 50
Cross-correlation due to ballistic rings (grid V=1.8mm/s)
Cross-correlation of vortex ring signal (grid v=1.8mm/s)
Peak at Δt ∼ − 0.15s for 2mm separation, implies a ring velocity of ∼ 13mm/s.
SLIDE 51
Cross-correlation due to ballistic rings (grid V=2.6mm/s)
Cross-correlation of vortex signal (grid v=2.6mm/s)
Long tail develops as vortex tangle starts to form.
SLIDE 52
Cross-correlation due to ballistic rings (grid V=3.3mm/s)
Tangle almost fully developed (note the time axis is 10 times longer).
Cross-correlation of vortex signal (grid v=3.3mm/s)
SLIDE 53 Cross-correlation due to ballistic rings (grid V=5.7mm/s)
Cross-correlation of vortex tangle signal (grid v=5.7mm/s)
Peak at Δt ∼ − 2s, for 1mm separtation, suggests the tangle has a net outward velocity
SLIDE 54
Quasiparticle Imaging
Heated Radiator Box produces a beam of ballistic quasiparticles
SLIDE 55
Quasiparticle Imaging
Array of detectors (e.g. tuning forks) produce an image of the excitation beam flux.
SLIDE 56
Quasiparticle Imaging
We can then image the quasiparticle shadows cast by vortices or other superfluid structures. Can anything like this be done in superconductors ?