
SLIDE 1
8/24/2009 1
Evaluation of Evaluation of Sensor Sensor Based Based Residential Residential Irrigation Water Irrigation Water Application Application
Melissa B. Haley Melissa B. Haley
Agricultural & Biological Engineering Agricultural & Biological Engineering
Michael D. Dukes Michael D. Dukes
Agricultural & Biological Engineering Agricultural & Biological Engineering
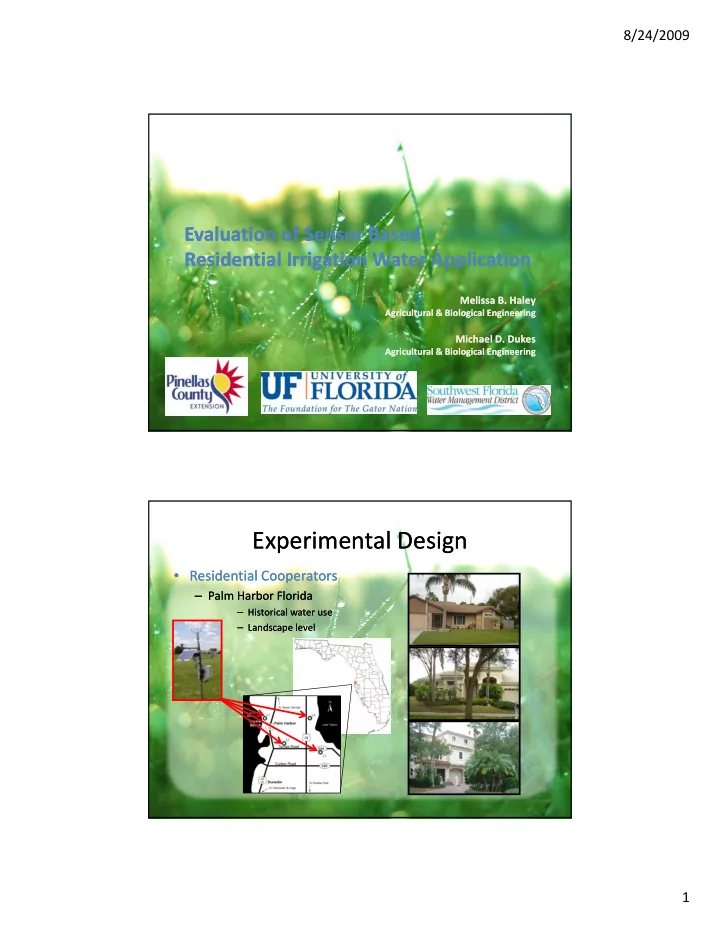
Experimental Design Experimental Design
- Residential
Residential Cooperators Cooperators
– Palm Harbor Florida Palm Harbor Florida
– Historical water use Historical water use – Landscape level Landscape level