example find intervals where the function f x x 2 16 x is
play

Example: Find intervals where the function f ( x ) = x 2 16 x is - PDF document

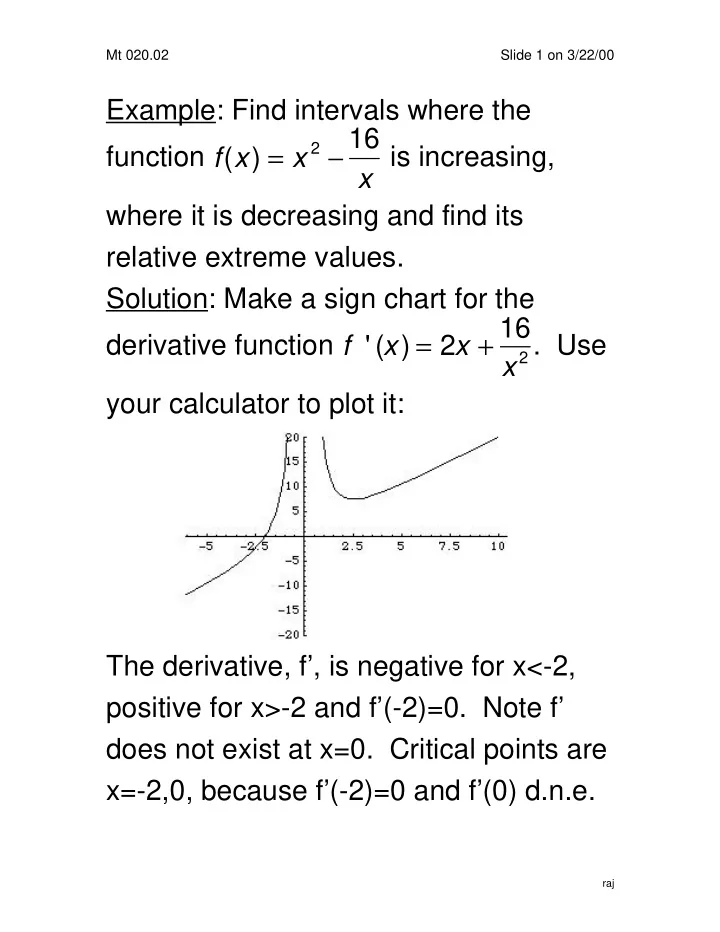
Mt 020.02 Slide 1 on 3/22/00 Example: Find intervals where the function f ( x ) = x 2 16 x is increasing, where it is decreasing and find its relative extreme values. Solution: Make a sign chart for the derivative function f ' ( x ) = 2 x +


  1. Mt 020.02 Slide 1 on 3/22/00 Example: Find intervals where the function f ( x ) = x 2 − 16 x is increasing, where it is decreasing and find its relative extreme values. Solution: Make a sign chart for the derivative function f ' ( x ) = 2 x + 16 x 2 . Use your calculator to plot it: The derivative, f’, is negative for x<-2, positive for x>-2 and f’(-2)=0. Note f’ does not exist at x=0. Critical points are x=-2,0, because f’(-2)=0 and f’(0) d.n.e. raj

  2. Mt 020.02 Slide 2 on 3/22/00 Here’s our sign chart for the derivative f’: f’ -------|+++++++++|++++++++++++++ -2 0 Thus the original function, f(x), is decreasing on the interval (-infinity,-2), and increasing across (-2,0) and (0,infinity). Since the sign of f’ changes across x=-2 from neg. to pos. we see that x=-2 is the location of a relative min. of the function f(x), and that f(-2)=12 is the relative min. Here’s the graph of f and you can see the results are correct: raj

  3. Mt 020.02 Slide 3 on 3/22/00 Example: The concentration of a certain drug in a patient’s blood t hours after t 2 2 t 3 + 1 for 0 ≤ t ≤ 4 and injection is C ( t ) = C is measured in milligrams per cubic centimeter. When is the concentration of the drug increasing and when is it decreasing? Solution: Differentiate C(t) and draw a t ) = 2 t (1 − t 3 ) sign chart. C ' ( (2 t 3 + 1) 2 and we get f’ +++++++++|---------------------------------- 1 raj

  4. Mt 020.02 Slide 4 on 3/22/00 This sign chart tells us that the concentration of the drug in the blood increases (f’>0) for 0 ≤ t ≤ 1, but decreases thereafter (since f’<0 after t=1). Concentration reaches a max at t=1. We move forward to finding a way to distinguish between two kinds of increasing. We call them concave up (holds water) and concave down (spills water). Observe what happens to the tangent lines’ slopes as we cross these two different curves with increasing x values. raj

  5. Mt 020.02 Slide 5 on 3/22/00 Across the concave up, the slopes go from small+, to medium+ to large+, obviously growing bigger, thus increasing. The SLOPE is increasing as we increase x, the DERIVATIVE is what we called an increasing function, and that is signaled by ITS derivative being positive. So (f’)’ = f’’>0, the second derivative being positive signals f’ is increasing which says that f, itself, the original function is concave up. A similar argument says f’’<0 forces f to be concave down. Pictures below: raj

  6. Mt 020.02 Slide 6 on 3/22/00 Example: Find all interesting features of the function f ( x ) = 0.05 x 5 − 4 3 x 3 + 3 x − 7. In particular find where it is increasing, decreasing, concave up, concave down, relative extremes and where the convavity changes (points of inflection). Solution: We’ll need graphs and sign charts for both f’ and f’’ to solve this. Here are both for f’: f’ +++++|------------|++++|--------|++++++ -3.9 -.89 .89 3.9 raj

  7. Mt 020.02 Slide 7 on 3/22/00 So f is increasing on (-inf,-3.9),(-.89,.89) and (3.9,inf) and decreasing on (-3.9,-.89) and (.89,3.9). These x-values can be obtained using the ‘intersect’ feature of your calculator with y=0 and y=the derivative function. It looks like f takes local max values at x=–3.9, and x=.89 and local mins at x=-.89 and x=3.9. And here are the graph and sign chart for the second derivative, f’’ And the sign chart for f’’ is raj

  8. Mt 020.02 Slide 8 on 3/22/00 f’’ -----------|++++++++|-----------|+++++++ -2.83 0 2.83 This chart speaks about the convavity of the graph of f. It seems that the graph of f is concave down across (-inf, -2.83) and also across (0,2.83). Also f is concave up for x values in (-2.83,0), and also across (2.83,inf). Points of inflection (concavity changes) occur at x=-2.83, x=0 and x=2.83. Here’s a graph of f(x): raj

Download Presentation
Download Policy: The content available on the website is offered to you 'AS IS' for your personal information and use only. It cannot be commercialized, licensed, or distributed on other websites without prior consent from the author. To download a presentation, simply click this link. If you encounter any difficulties during the download process, it's possible that the publisher has removed the file from their server.

Recommend


More recommend