
SLIDE 1
EVALUATION OF THE STATE OF STREET RELATED INFRASTRUCTURE PROGRAMS IN LOS ANGELES Published Fall 2017
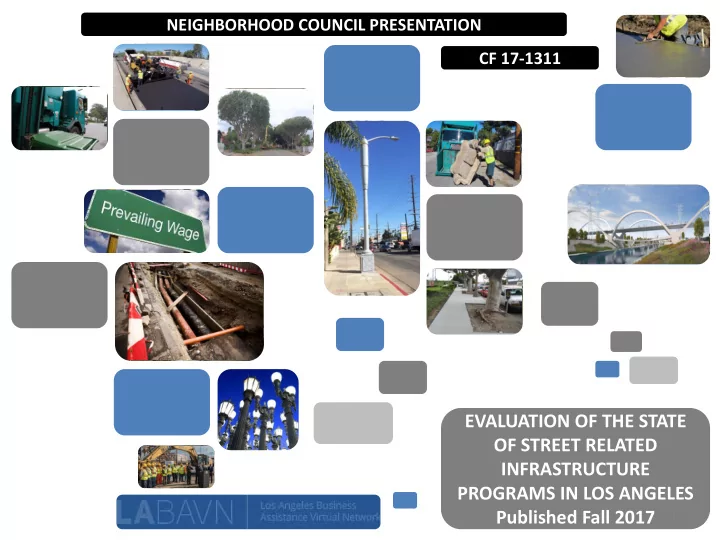
1NEIGHBORHOOD COUNCIL PRESENTATION CF 17-1311
EVALUATION OF THE STATE OF STREET RELATED INFRASTRUCTURE PROGRAMS - - PowerPoint PPT Presentation
NEIGHBORHOOD COUNCIL PRESENTATION CF 17-1311 EVALUATION OF THE STATE OF STREET RELATED INFRASTRUCTURE PROGRAMS IN LOS ANGELES Published Fall 2017 1 Overall Project Objective Desired Outcomes: Improved coordination among City departments and
EVALUATION OF THE STATE OF STREET RELATED INFRASTRUCTURE PROGRAMS IN LOS ANGELES Published Fall 2017
1NEIGHBORHOOD COUNCIL PRESENTATION CF 17-1311
Overall Project Objective
2Desired Outcomes:
partners will ensure that delivery of Public Works services are delivered in the most efficient and effective manner
Project Tasks:
accountability and service delivery
Current State of Street Related Programs and Services
3AD
DBS BSS BSS BSL BSS DOT DOT DWP BSS DOT BOE DWP BSL BSS BSS BOS BOS BSS DOT DOT BSL DOT BSL DOT DOT DBS DOT DOT BSL BSL BSS BSL DOT BOS BSS BSS BCA Planning Planning BOE BOE BOE BOE DOT BOS BSL DOT BCA BCA
TRANSPORTATION COMMISSION TAXI COMMISSION WATER AND POWER BOARD PUBLIC WORKS BOARDBOE DOT DWP DOT BOE BOE DOT BOE BOE BOS BOE DOT DCA DCA BSL DOT DOT BCA
MULTIPLE OVERSIGHT COMMISSIONS:BSL BSS BSS BSS BSS
Department of Public Works Department of Transportation Department of Water and Power Other City Dept/External GroupEverything shares the street: How we govern these programs on paper
Last update: 6/6/18 Everything shares the street: How we govern these programs on paper
DOT – traffic plan review 4 BSS - potholes BSS – street sweeping BSL – light pole arms DOT – bike lanes DOT – traffic planning DOT – taxi/carshare BSS – bus pads BOS – storm drains BSS - medians DOT – traffic officers DOT – crosswalk DOT - DASH DOT - parking BOE – U permits BCA - inspectionIn the street programs
BSS - pavement BSS – curb and gutter DOT – striping BOE – reconstructed streets BOE – surveying BOS – sewer holes DOT – ATSAC sensors Department of Public Works Department of Transportation Department of Water and Power BSS – tree review DBS – plan review Planning – zoning compliance BOE – B permitBuildings – private development
BCA - inspection Private firms BSS – reconstructed streets BSS – sidewalks BSS – sidewalk vending DOT – walk signals DWP – tree trimming BSS – ADA ramps BSS – bus bench BSL - banners DOT – tree trimming BSL – street light control box DOT – parking meters BSL – street light BOS - recycling BSS – tree trimming DOT – traffic light BOE - surveying BOE – sidewalk design DWP – electricity pole DOT – parking signs BOE – ADA ramp design BOS – trash collectionAdjacent to the street programs
BOS – bulky item BOS – illegal dumping DOT – ATSAC traffic control box DOT – street signs BSL – EV charging DWP – EV charging BOS – homeless encampment cleanups DOT – bike racks GSD – EV charging Metro – tree trimming BCA - inspection BSS - trees LAPD – homeless encampments BOE – permits BSL – light poles BSL – decorative lights BSS – special event permitsUnder the street programs
DWP – water lines BCA - inspection BOS – sewer lines BOE – sewer design BOE – stormwater design BSS – utility coordination Private firms Other City Dept/External Group DOT – traffic plan reviewCurrent State of Street Related Programs and Services
– – Sample – not all inclusive of street programs Who is in Charge of Infrastructure and Related Programs in the City?
10 different responses were offered to this question. The most common answer was “no one,” followed by the MayorCity Council
Angelenos
Council Committees Deputy Mayor
Size represents frequency of responses from internal and external stakeholder interview processBoard of Public Works
Joe Buscaino
Employees
CAO
5 Research Design and Methodology
6external partners
Research - End User Surveys, Constituents
7Rated high quality Rated low quality 0% 10% 20% 30% 40% 50% 60% 70% 80% 90% 100%
Please rate the quality of the following services on a scale of 1 to 10 (1 = low, 10 = high):
6 AND OVER 5 AND BELOW
Fielded in Spring/Summer 2017 Research - End User Surveys, Constituents
80% 10% 20% 30% 40% 50% 60% 70% 80% 90% 100%
Have these services improved over the past 5 years?
Yes No Most improved services
Research - End User Surveys, Constituents
9CD7: Sidewalk repair, street sweeping, street repair
Of the programs listed on the survey, which services would you want improved first? (Ranked in order of preference)
CD2: Street repair, street lighting, street sweeping CD13: Street sweeping, homeless encampments, street striping CD1: Tree trimming, sidewalk repair, street striping CD3: Tree trimming, street repair, bulky item pick up CD4: Street sweeping, homeless encampments, bulky item pick up CD5: Street lighting, street signs, sidewalk repair CD6: Street repair, bulky item pick up, illegal dumping CD8: Tree trimming, sidewalk repair, street repair CD9: Sidewalk repair, street repair, tree trimming CD10: Sidewalk repair, tree trimming, weed abatement CD11: Sidewalk repair, traffic light timing, illegal dumping CD14: Street lighting, tree trimming, illegal dumping CD15: Sidewalk repair, illegal dumping, street lighting CD12: Parking, traffic enforcement, street sweeping Overall constituent feedback – Top 3:
Research - End User Surveys, Constituents
1055% 73% 73% 44% 27% 18% 27% 56% 18% 9% 0% 10% 20% 30% 40% 50% 60% 70% 80% 90% 100%
Ease of walking in Los Angeles Ease of travel by car on City streets Cleanliness of Los Angeles Responsiveness to constituent requests
How would you rate the following aspects of Los Angeles?
(4 point scale - Poor, Fair, Good, Excellent) Poor Fair Good
Research - End User Surveys, Constituents
11 “CC” is City Council offices in the 3rd column75% 92% 42% 75% 25% 92% 58% 25% 8% 57% 25% 75% 8% 42% 0% 10% 20% 30% 40% 50% 60% 70% 80% 90% 100%
Observed a code violation (weeds, graffiti, etc.) Used LA311 to report an issue with City services Contacted CC to report an issue with City services Followed a City Facebook account (LA Mayor, Fire, etc.) Followed a City Twitter account (LA Mayor, Sanitation, etc.) Visited the City’s website Used public transportation instead of driving
In the last 6 months, have you done any of these activities:
(Yes or No)Yes No
Data Analysis on Service Needs
Top 3 Requested Program Improvements from Constituent Surveys
CD7: Sidewalk repair, street sweeping, street repair CD2: Street repair, street lighting, street sweeping CD13: Street sweeping, homeless encampments, street striping CD1: Tree trimming, sidewalk repair, street striping CD3: Tree trimming, street repair, bulky item pickup CD4: Street sweeping, homeless encampments, bulky item pick up CD5: Street lighting, street signs, sidewalk repair CD6: Street repair, bulky item pick up, illegal dumping CD8: Tree trimming, sidewalk repair, street repair CD9: Sidewalk repair, street repair, tree trimming CD10: Sidewalk repair, tree trimming, weed abatement CD11: Sidewalk repair, traffic light timing, illegal dumping CD14: Street lighting, tree trimming, illegal dumping CD15: Sidewalk repair, illegal dumping, street lighting CD12: Parking, traffic enforcement, street sweeping OVERALL: SIDEWALK REPAIR, TREE TRIMMING, STREET REPAIRTop 3 Constituent Requests from LA311
Graffiti removal, bulky items, metal/household appliances Bulky items, graffiti removal, metal/household appliances Bulky items, graffiti removal, metal/household appliances Bulky items, graffiti removal, metal/household appliances Graffiti removal, bulky items, metal/household appliances Bulky items, graffiti removal, metal/household appliances Bulky items, graffiti removal, metal/household appliances Bulky items, graffiti removal, metal/household appliances Bulky items, graffiti removal, metal/household appliances Bulky items, graffiti removal, metal/household appliances Bulky items, graffiti removal, electronic waste Bulky items, graffiti removal, metal/household appliances Bulky items, graffiti removal, metal/household appliances Bulky items, graffiti removal, metal/household appliances Graffiti removal, bulky items, metal/household appliances Bulky items, graffiti removal, metal/household appliances 12% of LA311 Total
86% 84% 81% 80% 79% 83% 80% 83% 89% 85% 81% 82% 87% 85% 81% 81% LA311 totals from data from FY15-FY17 Research - End User Surveys, BIDs
13 BIDs are important partners in maintaining infrastructure in their respective districts. In the City, “a BID is a geographically defined area within the City of Los Angeles, in which services, activities and programs are paid for through a special assessment which is charged to all members within the district in order to equitably distribute the benefits received and the costs incurred to provide the agreed-upon services, activities and programs.”72 These services can range from supplemental trash collection to tree trimming services. There are currently 41 BIDs in the City and the survey had a 60% response rate. 72 http://clerk.lacity.org/business-improvement-districts/what-business-improvement-district Research - End User Surveys, BIDs
14 0% 10% 20% 30% 40% 50% 60% 70% 80% 90% 100%Have these services improved over the past 5 years?
Yes No Research - End User Surveys, BIDs
15 50% 50% 50% 100% 50% 50% 50% 0% 10% 20% 30% 40% 50% 60% 70% 80% 90% 100% Ease of walking in Los Angeles Ease of travel by car on City streets Cleanliness of Los Angeles Responsiveness to constituent requestsHow would you rate the following aspects of Los Angeles?
(4 point scale - Poor, Fair, Good, Excellent) Poor Fair Good Research - End User Surveys, BIDs
16 “CC” is City Council offices in the 3rd column 100% 100% 100% 100% 100% 100% 100% 0% 10% 20% 30% 40% 50% 60% 70% 80% 90% 100% Observed a code violation (weeds, graffiti, etc.) Used LA311 to report an issue with City services Contacted CC to report an issue with City services Followed a City Facebook account (LA Mayor, Fire, etc.) Followed a City Twitter account (LA Mayor, Sanitation, etc.) Visited the City’s website Used public transportation instead of drivingIn the last 6 months, have you done any of these activities:
(Yes or No) Yes No Themes consistently cited as barriers to performance across research groups
Key Barriers to Performance
17Lack of Customer Centricity:
Need to build stronger relationships with our constituents by putting the customer firstLack of Alignment:
Need to address decentralized governance of infrastructure programs and differing goals which can unintentionally impact service delivery to our residentsLack of Planning:
Need better planning using a strategic,Lack of Communication:
Need to break down siloes between divisions, Bureaus and departments and share relevant information across groups in a timely mannerLack of Data & Technology:
Need better data collection, data sharing and usage, integrated with technology solutions where appropriate, to manage programsLack of Coordination:
Need to synchronize street related programs so activities are sequenced and completed in the correct order to preserve investments and improve on-time project delivery Priority Criteria for Selection of Recommendations
There are more than a dozen recommendations put forward by this report that are recommended for adoption. To support decision makers, recommendations were considered against three dimensions:Organization for Report Recommendations
18Tier 1: Systems improvement
(2 recommendations)
Tier 2: Support systems improvements
(6 recommendations)
Tier 3: Process and program efficiencies
(5 recommendations)
Executive Summary
Objective: This project was tasked to look at the system in which street infrastructure related services exist, to identify ways the City can improve delivery of these programs, and to highlight innovative practices within the City and other jurisdictions that can be scaled for success. Design: Using a multi-pronged research approach consisting of staff interviews, constituent surveys, site visits, bench marking, data analysis and a problem solving Lab, a set of recommendations is being presented for adoption and implementation. Research: Twelve groups of stakeholders were identified as part of the investigative process, including internal city departments and external partners. Over 400 interviews were conducted to gain an understanding of the effectiveness of the current system. Concerns reiterated across multiple groups included 1) programmatic vs systems thinking 2) proactive vs reactive planning 3) strategic vs tactical practice 4) lacking communication across City departments and with constituents 5) preventative vs deferred activities 6) competitive vs collaborative nature 7) lack of coordination in cross- departmental programs 8) undoing and redoing of work due to misaligned goals and 9) underuse of data in program analysis and decision making Data collected in the design and research phases led to six central themes: Planning, Data, Coordination, Communication, Alignment, and Customer Centricity. These serve as the basis for the recommendations and each recommendation is assigned to multiple themes. Theory of Change: The City’s street network is one of its largest assets. Every infrastructure program in the City has assets under, on, or over the street. The street is the binding element for multiple departments: homes would not have water, electricity, or sewer services without connections below ground. Cars, bikes, buses would not know traffic or parking rules without signals, signage, or meters on the surface of the street. People could not walk safely in the right of way without sidewalks, crosswalks, ramps and street Executive Summary
Tier 2: Improvements to Infrastructure Support Systems