
SLIDE 1
International Institute of Tropical Agriculture – Institut international d’agriculture tropicale – www.iita.org
ESTIMATING YIELDS AND YIELD GAPS: Experiences from East Africa - - PowerPoint PPT Presentation
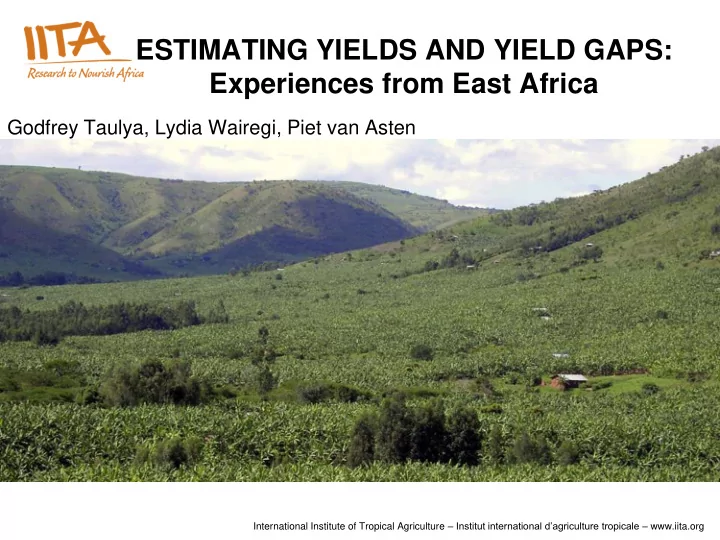
ESTIMATING YIELDS AND YIELD GAPS: Experiences from East Africa Godfrey Taulya, Lydia Wairegi, Piet van Asten International Institute of Tropical Agriculture Institut international dagriculture tropicale www.iita.org PRESENTATION
International Institute of Tropical Agriculture – Institut international d’agriculture tropicale – www.iita.org
International Institute of Tropical Agriculture – Institut international d’agriculture tropicale – www.iita.org
International Institute of Tropical Agriculture – Institut international d’agriculture tropicale – www.iita.org
International Institute of Tropical Agriculture – Institut international d’agriculture tropicale – www.iita.org
International Institute of Tropical Agriculture – Institut international d’agriculture tropicale – www.iita.org
International Institute of Tropical Agriculture – Institut international d’agriculture tropicale – www.iita.org
International Institute of Tropical Agriculture – Institut international d’agriculture tropicale – www.iita.org
International Institute of Tropical Agriculture – Institut international d’agriculture tropicale – www.iita.org
International Institute of Tropical Agriculture – Institut international d’agriculture tropicale – www.iita.org
International Institute of Tropical Agriculture – Institut international d’agriculture tropicale – www.iita.org
International Institute of Tropical Agriculture – Institut international d’agriculture tropicale – www.iita.org
International Institute of Tropical Agriculture – Institut international d’agriculture tropicale – www.iita.org
International Institute of Tropical Agriculture – Institut international d’agriculture tropicale – www.iita.org