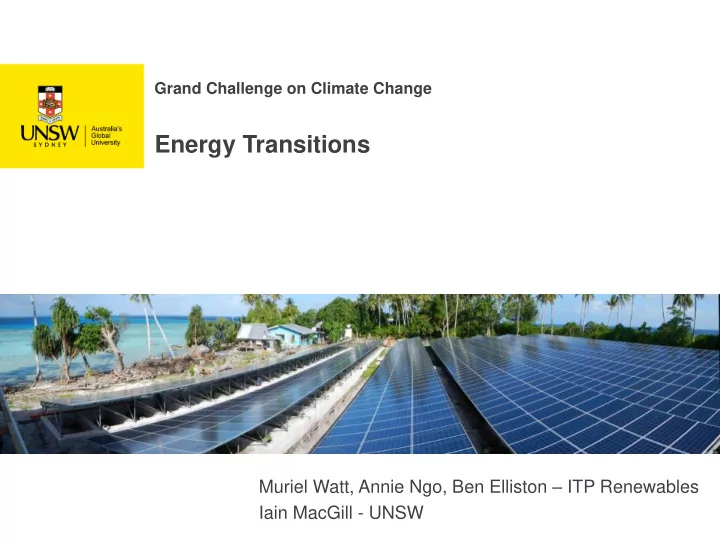

Grand Challenge on Climate Change Energy Transitions Muriel Watt, Annie Ngo, Ben Elliston – ITP Renewables Iain MacGill - UNSW
Global Emissions Source: National Oceanic and Atmospheric Administration
The legacy of the last 100 years Energy responsible for > 2/3 of GHG emissions High reliance on fossil fuels Geopolitical and centralised power Large global fossil fuel supply chains Strong resistance to change Highly inequitable: Developed countries >200 GJ/person/year Developing countries <20 GJ/person/year Technology, infrastructure, governance not suited to 21 st century energy systems
Emissions must drop to net zero by 2050 400ppm 1.5º temp rise 50 45 40 CO2 emissions (Gt per year) Any delay makes 35 the transition 30 harder, not easier! 25 20 15 10 5 0 2017 2020 2026 2050 Base Delay
How do we make the Transition? Fuel change transitions displacement of fuels Technology driven transitions changes in energy technology increased efficiency Transitions in market design and institutions in part to facilitate the other transitions
What can we agree upon? A carbon price, so emissions are factored into investment and asset decisions Significantly reduced reliance on coal and oil A range of clean energy technologies, with renewables key A significant role for energy efficiency Market mechanisms and technologies to manage high penetration variable renewables More engaged and informed energy users Integrated planning across: energy, water and other services liveable, affordable and healthy living environments urban planning and transport to prevent lock-in to inefficient systems
Where there is still some debate? • The future role for carbon capture and storage and nuclear both have struggled with cost and deployment • The role of gas • The role of hydrogen as another energy vector • The extent of the challenges posed by integration of variable renewables • The extent of changes needed in energy market design • Future cost reductions for different renewable energy technologies
Possible Australian Transitions Fuel change transitions 2017 2018 2019 2020 2021 2022 2023 2024 2025 2026 Phase out of brown coal Renewables replace fossil fuels Gas displaces coal Synthetic hydrocarbons replace fossil fuels for transport Biofuels and Hydrogen replace fossil fuels for transport Technology driven transitions 2017 2018 2019 2020 2021 2022 2023 2024 2025 2026 Energy efficiency reduces energy demand Distributed generation replaces centralised generation Energy storage used more widely Electricity replaces hydrocarbons for transport Load management to balance energy supply and demand Smart cities, buildings, devices Carbon capture and storage added to coal plant Transitions in market design and institutions 2017 2018 2019 2020 2021 2022 2023 2024 2025 2026 Reform of energy markets
Sustainable Energy Futures More renewable More electric More distributed and consumer driven More digital More flexible More global and more local
A way forward for Australia We can have affordable, secure, environmentally sustainable energy Reduce emissions fast – we have the perfect opportunity Aging coal fleet, reducing oil stocks, loss of manufacturing, congested cities, sparse rural populations, vast renewable energies Australia has the responsibility to assist other countries Good governance crucial Markets are a means not an end Political processes not well suited Don’t use uncertain climate change impacts to delay action ! Coherence between domestic policy and global agreements Transition must facilitate shared prosperity and equity
Equity Metrics 18 16 4X higher if exports included! 14 12 OECD 9.36 t CO2 / capita 10 World 4.47 8 6 4 2 0 United States Australia EU UK New Zealand Japan China
Recommend
More recommend