
SLIDE 1
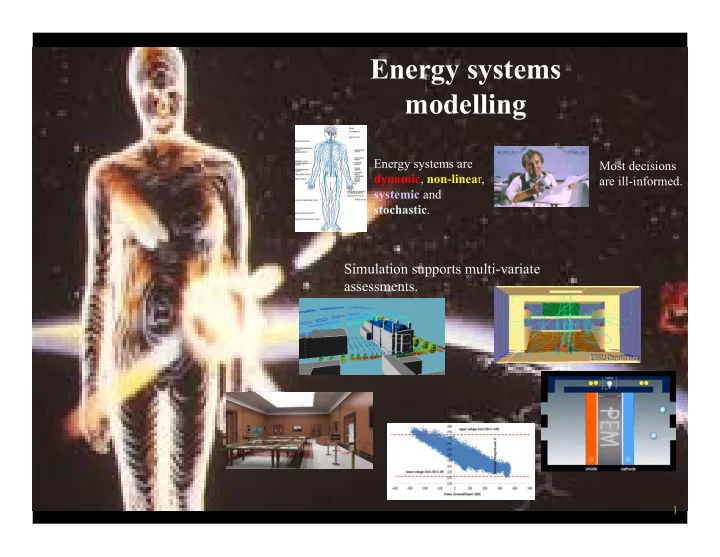
Simulation supports multi-variate assessments.
Most decisions are ill-informed. Energy systems are dynamic, non-linear, systemic and stochastic.
Energy systems modelling
1
Energy systems modelling Energy systems are Most decisions dynamic - - PowerPoint PPT Presentation
Energy systems modelling Energy systems are Most decisions dynamic , non-linea r, are ill-informed. systemic and stochastic . Simulation supports multi-variate assessments. 1 Myriad supply side transition options strategic fossil
Most decisions are ill-informed. Energy systems are dynamic, non-linear, systemic and stochastic.
1
Clean energy transition agendas inextricably link supply and demand issues. strategic renewables (future) nuclear fossil fuels energy storage urban renewables strategic renewables (present)
2
Virtual prototyping is required to select from competing possibilities. Trends: growing diversity & complexity; scale extension; linking of energy, environment, wellbeing and productivity; life cycle assessment including uncertainty and risk; retrofit planning; policy development.
3
Requires whole system thinking and agreement on analysis scenarios and criteria.
Cost reduction Wellbeing Fuel poverty Air quality Hybrid systems Smart control Network impacts Comms resilience Supply resilience New business models Legislation compliance Unintentional impacts Stochastic influences Work practices Policy conflicts
Electrification of heat Net-zero energy Electric vehicle charging District heating/ power Smart districts
Active
Network
Controller Local
Interface
Controller
Charge controller Water heating Space heating
Smart grid
CHP HP BB PV FC DWT Demand reshaping Public supply connection energy storage
Energy service companies Embedded RES 4
interrogations
(2050-calculator-tool.decc.gov.uk/)
5
China: http://2050pathway.chinaenergyoutlook.org/ India: http://indiaenergy.gov.in/ South Korea: http://2050.sejong.ac.kr/ Taiwan: http://my2050.twenergy.org.tw South Africa: https://www.environment.gov.za (link middle left of homepage) Belgium: http://www.climatechange.be/2050/ and also Wallonia (a region of Belgium): http://www.wbc2050.be Japan: http://www.2050-low-carbon-navi.jp/web/en/ (english) http://www.2050-low-carbon-navi.jp/web/jp/index.html (Japanese) Draft version for Indonesia: http://calculator2050.esdm.go.id/ Draft version for Thailand: http://122.155.202.232/
Source: MacKay, www.withouthotair.com
Diversity NIMBY LibDem Green Economist
Issues: new technology vs. lifestyle change; political imperative; balance of options; supportive legislation.
UK total: 196 kWh/d.p
6
Issues: resilient comms; cybersecurity; consumer participation; ESCo growth; service quality assurance.
database of actual & future consumption metered data information for government, local authorities, institutions, industry, utilities, citizens and others consumption/emissions monitoring; city profiling; property classification; trend analysis; action planning; equipment monitoring/control; post-
Queries: energy use profiling; heat-to-power ratios; district heating feasibility; daylight/solar/wind access; fuel poverty distribution; carbon maps. remote monitoring e-Service delivery:
alarms & alerts; conditions monitoring; local & aggregate control; health services; information.
scenario simulation
7
8
EnTrak (https://www.strath.ac.uk/research/energysystemsresearchunit/applications/entrak/)
load management combinatorial search supply scenarios demand scenario goodness
auxiliary duty cycle surplus
supply v. demand Merit (https://www.strath.ac.uk/research/energysystemsresearchunit/applications/merit/)
9
Supply + Battery D em and D emand Supply + Generator
62% 81%
(Robinson, 2012)
Issues: active network control; user needs and expectations; who benefits; unintentional impacts; tariff complexity; understanding building physics.
10
11
https://www.strath.ac.uk/research/energysystemsresearchunit/applications/esp-r/
Violation of these predicates leads to a calculation tool, not simulation for reality emulation.
Defining data are non-linear Influences are stochastic Energy processes are dynamic Overall problem is systemic
Capital/ running/ maintenance cost Thermal/ visual comfort Emissions/ air quality Network interaction/ power quality Demand/ supply matching Adaptability/ resilience
Occupants Equipment failure
12
13
glare and daylight power quality thermal bridges & mould growth mean age of air control dynamics clean combustion
14
Pre-upgrade (kWh) Post-upgrade (kWh) January 1,766 1,519 February 1,413 1,218 March 1,224 1,054 April 1,156 994 May 662 567 June 246 212 July 30 24 August 123 94 September 492 399 October 796 667 November 1,380 1,170 December 1,660 1,418 Annual 10,948 9,336 Gas consumption* 13,516 11,526 Annual saving* — £84 *Based on a typical gas-heated home with an 81% efficient boiler and tariff of 4.21 p/kWh.
High resolution model created. Simulations undertaken to quantify potential best outcome. Benchmarks formulated for all house types.
15
Car park PV for EV charging Smart street lighting Automobile performance Pollution avoidance
Issues: validation; accreditation; standard performance assessment methods; education & training.
16
17
increasing effort
18
Demand reduction through transparent insulation, advanced glazing and smart control. PV: 0.7 kWe DWT: 0.6 kWe PV hybrid: 0.8 kWe / 1.5 kWh
total demand: 68 kWh/m2.yr total RE supply: 98 kWh/m2.yr
Lighthouse Building, Glasgow
Issues: accommodating the grade, variability and unpredictability of energy sources/demands; hybrid systems design and maintenance; strategies for co-operative control of stochastic demand and supply; active network control for network balancing, fault handling and power quality maintenance.
19
20
Simulation tools can be used to generate representative demand and supply profiles.
public energy supply connection Energy storage Heat generation Electricity generation
21
Energy in:
power
power Energy stored:
Amenity :
Energy out:
Active Network Manager Local Interface Controller Charge schedule Energy in:
power Energy stored:
capacity Amenity:
Energy out:
temperature Hot water storage Space heater storage
ANM controls power station units and switches wind generators in response to demand. Energy storage devices are controlled centrally: 1 MW battery, 4 MW district heating store, and domestic energy storage with total capacity of 2.1 MW distributed across 235 dwellings. Basic instruction is a power input schedule by ¼ hour for the upcoming 24 hour period based on anticipated supply, demand and network status. System uses space and water heaters to store energy to level out demand; heaters respond to external charge schedule and grid frequency.
22
23
24
25
26
27
28
29
30
31
IBPSA Fellowships
Argentina Italy Australasia Japan Brazil Korea Canada Netherlands + Flanders China Nordic Chile Poland Czech Republic Scotland Danube Singapore Egypt Slovakia England Spain France Switzerland Germany Turkey India United Arab Emirates Ireland USA
Issues: buy-in to the computational approach to design; extension to all relevant domains; collaborative pursuit of a future vision.
32
Issues: computational approach to design; distinction between tools for compliance and prediction; applicability of the check-list approach.
33