Energy Infrastructure Map of the World Varun Nair Tamasha - - PowerPoint PPT Presentation

energy infrastructure map of the world
SMART_READER_LITE
LIVE PREVIEW

Energy Infrastructure Map of the World Varun Nair Tamasha - - PowerPoint PPT Presentation

Energy Infrastructure Map of the World Varun Nair Tamasha Pathirathna Xiaolan You Qiwei Han Dr. Kyle Bradbury The Problem Our Solution Our team created a dataset of electricity An estimated 1.06 billion people of the


slide-1
SLIDE 1

Energy Infrastructure Map of the World

Varun Nair ● Tamasha Pathirathna ● Xiaolan You ● Qiwei Han ● Dr. Kyle Bradbury

An estimated 1.06 billion people of the global population lack access to

  • electricity. This problem is exacerbated

by a lack of comprehensive data about existing energy infrastructure.

Our Solution

Our team created a dataset of electricity infrastructure that can be used to automatically map the distribution and transmission components of the electric power grid. This is the first publicly available dataset of its kind, empowering policymakers and others to bring electricity to the people that lack it most.

The Problem

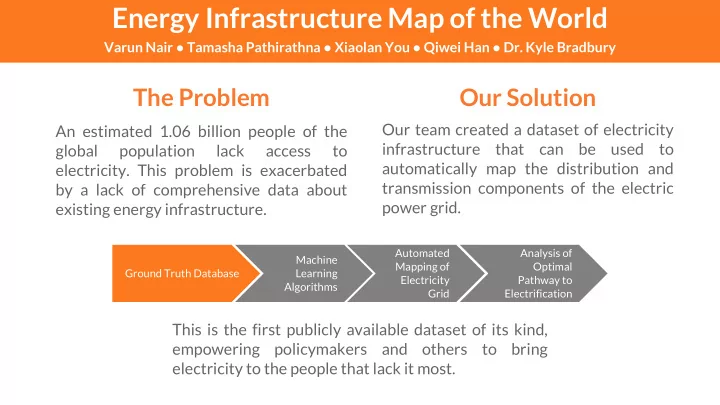
Ground Truth Database Machine Learning Algorithms Automated Mapping of Electricity Grid Analysis of Optimal Pathway to Electrification

slide-2
SLIDE 2

Ground view Shanghai China Shanghai China (labeled) Substation Transmission Distribution Our dataset consists of high resolution, geographically representative satellite images in which transmission and distribution infrastructure are labeled. The dataset covers 321 km2 across 14 cities on 5 continents. Images were labeled using Pyimannotate, a python-based image labeling tool developed by Artem Streltsov of the Duke Energy

  • Initiative. Transmission towers, distribution

towers, and substations were labeled with polygons while transmission and distribution lines were labeled with lines.

Approach to Dataset Creation

slide-3
SLIDE 3

Unlabeled Image Labeled Image Mask for Machine Learning

The dataset is published on figshare, an

  • nline data sharing platform. Each image is

published with: 1. Raw satellite imagery (.tif) 2. Annotations in multiple formats (.csv, .geojson) 3. Multiclass mask (.npz, .tif) The raw imagery and mask can be directly used to train machine learning models, which can then automatically map the electricity grid anywhere in the world.

figshare Database

18,572

Towers

936

km of Lines

14

Cities

318

Sq km of Imagery