Energy in the Biosphere With the exception of meteorites, the Earth - - PDF document

energy in the biosphere
SMART_READER_LITE
LIVE PREVIEW

Energy in the Biosphere With the exception of meteorites, the Earth - - PDF document

Unit A Chap 1 Class Slides.notebook May 04, 2011 Energy in the Biosphere With the exception of meteorites, the Earth has had the same supply of matter for billions of years - it is constantly recycled! 1. The energy the


slide-1
SLIDE 1

Unit A ­ Chap 1 ­ Class Slides.notebook 1 May 04, 2011

Energy in the Biosphere

With the exception of meteorites, the Earth has had the same supply of matter for billions of years - it is constantly recycled!

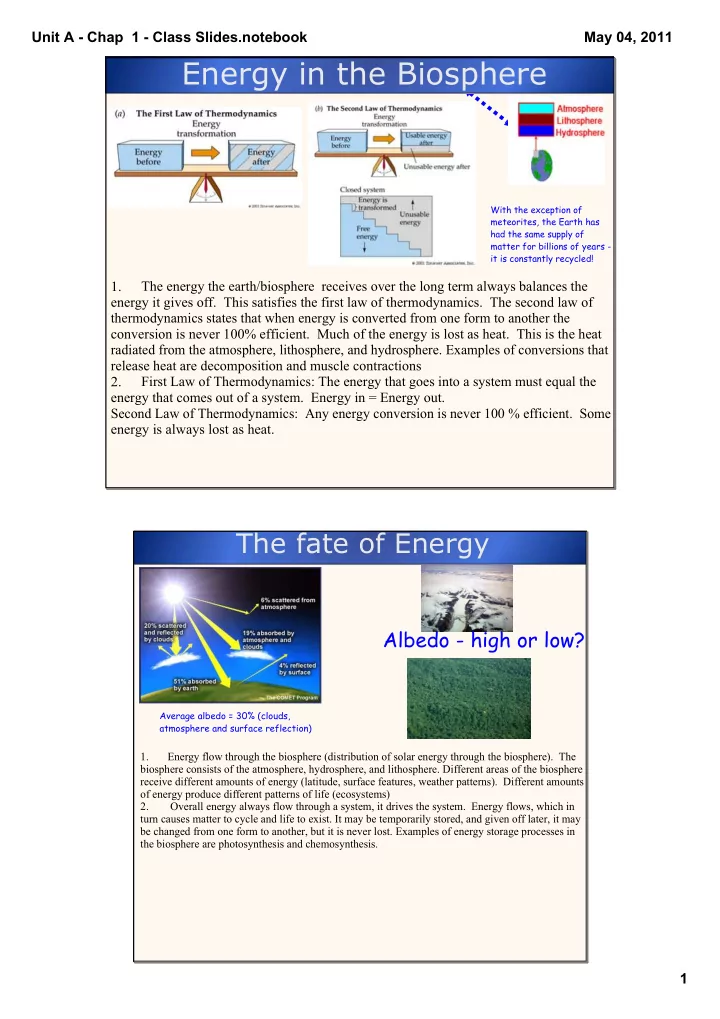
1. The energy the earth/biosphere receives over the long term always balances the energy it gives off. This satisfies the first law of thermodynamics. The second law of thermodynamics states that when energy is converted from one form to another the conversion is never 100% efficient. Much of the energy is lost as heat. This is the heat radiated from the atmosphere, lithosphere, and hydrosphere. Examples of conversions that release heat are decomposition and muscle contractions 2. First Law of Thermodynamics: The energy that goes into a system must equal the energy that comes out of a system. Energy in = Energy out. Second Law of Thermodynamics: Any energy conversion is never 100 % efficient. Some energy is always lost as heat.

Albedo - high or low?

Average albedo = 30% (clouds, atmosphere and surface reflection)

The fate of Energy

1. Energy flow through the biosphere (distribution of solar energy through the biosphere). The biosphere consists of the atmosphere, hydrosphere, and lithosphere. Different areas of the biosphere receive different amounts of energy (latitude, surface features, weather patterns). Different amounts

  • f energy produce different patterns of life (ecosystems)

2. Overall energy always flow through a system, it drives the system. Energy flows, which in turn causes matter to cycle and life to exist. It may be temporarily stored, and given off later, it may be changed from one form to another, but it is never lost. Examples of energy storage processes in the biosphere are photosynthesis and chemosynthesis.

slide-2
SLIDE 2

Unit A ­ Chap 1 ­ Class Slides.notebook 2 May 04, 2011

1-2% of the sun's energy is actually used... but producers generate 150- 200 billion tonnes of organic matter each year!

Energy Storage Examples

tubeworms

1. Photosynthesis: occurs in plants, some protozoa, and some bacteria. It is a chemical reaction that stores energy from sunlight in the chemical bonds of glucose and other sugars. It uses carbon dioxide and water, occurs in special cell organelles (chloroplasts in plants cells) and produces sugars and oxygen 2. Chemosynthesis: is a process that occurs in some bacteria that usually live in habitats with no

  • light. These organisms use the organic chemicals in the environment around them to produce
  • carbohydrates. The energy to link the molecules together comes from heat in the surrounding
  • environment. Usually these bacteria are found in the ocean floor around geothermal vents (hot water

springs)

Methods of Energy Transfer

1. Energy transfer through the biosphere is by conduction, convection, or radiation, or by energy stored in compounds in organisms which then pass the energy onto other organisms when they are eaten or decomposed. 2. Conduction: transfer of energy by direct contact ex. Heat transfer through metal bar 3. Convection: transfer of energy through a fluid ex. Warm air rises, convection currents 4. Radiation: transfer of energy through electromagnetic waves, ex. Light, microwaves, infrared

slide-3
SLIDE 3

Unit A ­ Chap 1 ­ Class Slides.notebook 3 May 04, 2011

How is energy made by producers accessed by consumers?

Photosynthesis and chemosynthesis both store energy in larger carbohydrate molecules. Cell respiration takes the large carbohydrate molecules and slowly releases this energy. The energy is used to do cellular processes (metabolism) such as building other molecules and is used to keep the cell warm. The waste products of respiration are reused by photosynthesis or indirectly by chemosynthesis to form the large carbohydrates again. Energy flow in photosynthetic environments starts with the sun (visible light) and continues through plants to animals and finishes with decomposers, forming food chains and webs. Energy flow in deep sea vents starts with thermal energy from the water (produces by nuclear breakdown of matter in the Earths crust) to bacteria to protozoa to animals to decomposers. As light intensity increases the rate of photosynthesis increases and the amount of energy storage by plants increases (their carbohydrate production increases).

Trophic Levels Ecology: the study of ecosystems Ecosystem: A community and its physical and chemical environment

  • biotic: the living organisms in an ecosystem
  • abiotic: the nonliving factors in the ecosystem (the physical and chemical

environment

slide-4
SLIDE 4

Unit A ­ Chap 1 ­ Class Slides.notebook 4 May 04, 2011 Trophic Levels Ecological niche: The role an organism occupies in the ecosystem. There are three basic niches. Trophic level: the location of an organism in the food chain. Also called its ecological niche. Producer: Are plants. They take a form of energy and use it to make carbohydrates and

  • ther large compounds out of

inorganic compounds (carbon dioxide, water). Autotrophs: are producers, plants or chemosynthetic bacteria Heterotrophs: are consumers, usually animals that eat animals or plants Consumer: Organism that eat producers or

  • ther consumers.

Decomposer: convert dead material back into smaller compounds, raw nutrients, to be reused by producers or other

  • rganisms in the

environment. Trophic Levels Primary consumer: A consumer that eats

  • producers. A herbivore

Secondary consumer: A consumer that eats primary consumers. A carnivore Tertiary consumer: A consumer that eats secondary consumers. A carnivore. Usually at the top of a food chain. Habitat: The environment a specific organism survives in. Geographic range: the total area in which an

  • rganism lives on the planet.

Herbivore: An animal that eats plants only Carnivore: An animal that eats animal tissue

  • nly.

Omnivore: An animal that eats both plant and animal tissue on a regular basis. Scavenger: An animal that eats dead animals. Detritivore: An animal that eats detritus Saprotroph: An organism that digests its food

  • utside its body then takes it in. Ex. Fungus,
  • molds. They are fit into the decomposer niche

Detritus: Any organic waste from animals and plants.

slide-5
SLIDE 5

Unit A ­ Chap 1 ­ Class Slides.notebook 5 May 04, 2011

Trophic Levels Food chain: A linear illustration of who eats whom in an ecosystem Food web: a series of interlocking food chains that illustrates who eats whom in an

  • ecosystem. This represents the transfer of energy and organic matter through the

trophic levels in an ecosystem. Trophic Levels Biological magnification (bioamplification): The buildup of toxic chemicals in

  • rganisms as tissues containing the chemical move through the food chain. The

toxic chemicals are absorbed by fatty tissue and stay in the body of the organism.

slide-6
SLIDE 6

Unit A ­ Chap 1 ­ Class Slides.notebook 6 May 04, 2011

Ecological Pyramids ­ Pyramid of Numbers

Ecological pyramids: another type of illustration of the flow of energy, matter and numbers in an ecosystem. Pyramid of numbers: Illustrates the total numbers of each organism in a food chain. The producer numbers are placed at the bottom while the top carnivore numbers are placed at the top of the pyramid.

Ecological Pyramids ­ Pyramid of Biomass

Pyramid of biomass : Illustrates the total biomass of the total population of each organism in a food chain. The producer biomass is placed at the bottom while the top carnivore biomass is placed at the top of the pyramid.

slide-7
SLIDE 7

Unit A ­ Chap 1 ­ Class Slides.notebook 7 May 04, 2011 Ecological Pyramids ­ Pyramid of Energy

ALWAYS UPRIGHT!

Pyramid of energy: Illustrates the total energy in the population of the organism in each trophic level in a food chain. The producer energy is placed at the bottom while the top carnivore energy is placed at the top of the pyramid.

How much energy gets passed on?

/10 /10 /10

As energy flows through ecosystems, stored in the chemical bonds in the organic compounds that compose the cells and cell compounds of the organism, some energy is always lost as heat, used by the organism for body functions, or released in the waste produced as the organism lives its life Therefore not all the energy an organism receives will be passed on to the next tropic level. The standard number used is 10%. Ten percent of the energy from one tropic level is used to support the next tropic level. This places a limit on the number of tropic levels in any given food chain or web. It also places a limit on the numbers of organism, and their biomass, at each tropic level. This can be illustrated in food chains or food webs, or in ecological pyramids. This also explains the shape of ecological pyramids. Their bases are very large, meaning a lot of energy, biomass, and numbers exist at the producer level, but as you go up the pyramid, to higher levels in the food chain, the available energy decreases with a corresponding decrease in biomass and numbers.

slide-8
SLIDE 8

Unit A ­ Chap 1 ­ Class Slides.notebook 8 May 04, 2011

Energy Transfer Example

Page 27, #10

Assume that a 1 square kilometre field produces 300t/km2 of grain in one year. The grain that is grown in the field produces 141 900 kJ/kg of energy. One beef cow, with an average mass of 500kg, needs 7.7 kg of grain every

  • day. Assume that an average person needs 2400KJ of energy per day and that beef contains 13 900kJ/kg.

a) How many cattle are supported? b) Number of people supported­ if they ate grain. c) Number of people supported ­ if they ate beef. d) Compare b) and c) ­­ what does it suggest about efficient use of farmland? 106 48595 840