
SLIDE 1
Energy Depositions For Lattices 1 and 2
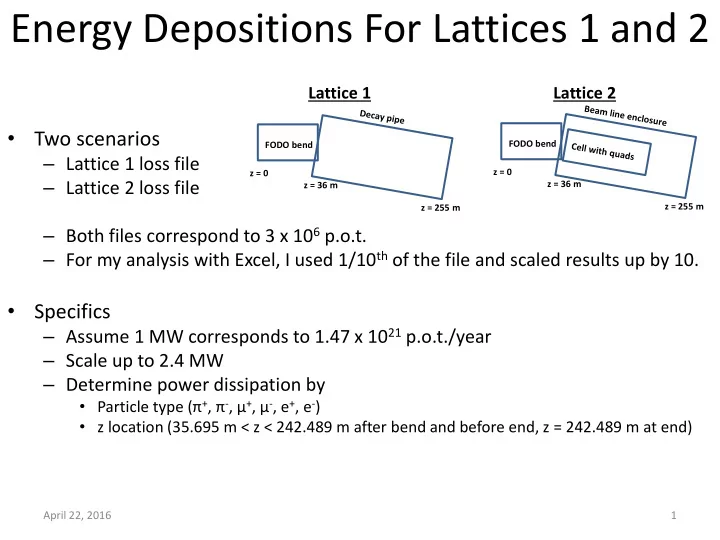
- Two scenarios
– Lattice 1 loss file – Lattice 2 loss file – Both files correspond to 3 x 10⁶ p.o.t. – For my analysis with Excel, I used 1/10th of the file and scaled results up by 10.
- Specifics
– Assume 1 MW corresponds to 1.47 x 10²¹ p.o.t./year – Scale up to 2.4 MW – Determine power dissipation by
- Particle type (π+, π-, μ+, μ-, e+, e-)
- z location (35.695 m < z < 242.489 m after bend and before end, z = 242.489 m at end)
April 22, 2016 1
FODO bend z = 0 z = 36 m z = 255 m
Lattice 1 Lattice 2
FODO bend z = 0 z = 36 m z = 255 m